 E-submission
 TOTA
TOTA TOTS
TOTS
Articles
- Page Path
- HOME > J Musculoskelet Trauma > Volume 39(2); 2026 > Article
-
Original Article
- Sex-specific bottlenecks and risk zones in the retrograde superior pubic ramus screw corridor: a 3D CT-based morphometric cadaver study
-
Ji Won Jeong1
 , Jung Tae Ahn1, Gu Hee Jung2,3, Kun Tae Kim1,4
 -
Journal of Musculoskeletal Trauma 2026;39(2):103-116.
DOI: https://doi.org/10.12671/jmt.2026.00066
Published online: March 26, 2026
1Department of Orthopedic Surgery, Gyeongsang National University Hospital, Gyeongsang National University College of Medicine, Jinju, Korea
2Department of Orthopedic Surgery, GIJANG Hospital, Busan, Korea
3Planner.surgery Co., Busan, Korea
4Department of Orthopedic Surgery, Gyeongnam Regional Trauma Center, Jinju, Korea
- Correspondence to: Kun Tae Kim Department of Orthopedic Surgery, Gyeongsang National University Hospital, Gyeongsang National University College of Medicine, 79 Gangnam-ro, Jinju 52727, Korea Tel: +82-55-750-9509 Email: os.tkra@gmail.com
• Received: January 22, 2026 • Revised: February 1, 2026 • Accepted: February 7, 2026
© 2026 The Korean Orthopaedic Trauma Association
This is an Open Access article distributed under the terms of the Creative Commons Attribution Non-Commercial License (http://creativecommons.org/licenses/by-nc/4.0/) which permits unrestricted noncommercial use, distribution, and reproduction in any medium, provided the original work is properly cited.
- 1,078 Views
- 29 Download
Abstract
-
Background Superior ramus screw fixation is commonly used to stabilize anterior pelvic ring injuries but is constrained by a narrow, irregular, and curved intraosseous corridor. Trajectory-based morphometric analysis may assist in screw diameter selection and enable identification of reproducible anatomic constriction zones.
-
Methods We conducted a cross-sectional computed tomography (CT)-based morphometric study of 82 cadaveric pelvises (42 males, 40 females). Bottleneck diameter was defined as the diameter of the largest fully contained virtual cylinder along the planned trajectory, and cylinder length was recorded. Orthogonal cross-sections at 9.5-mm intervals (up to 12 segments) were generated to measure segment-wise effective diameter (defined as twice the minimum centerline-to-cortex distance) and cortical clearance, which was used as a diameter-based safety margin. Segments were realigned to the acetabular start segment to define relative segment positions (Δ seg). Feasibility was assessed for prespecified screw diameters ranging from 3.5 to 7.3 mm.
-
Results Mean bottleneck diameter was larger in males than in females (7.34±1.10 vs. 5.93±0.98 mm), whereas trajectory length was similar between sexes (127.85±8.54 vs. 128.85±8.20 mm). Δ seg realignment localized corridor constriction to two discrete zones: a preacetabular zone (Δ seg −6 to −4) and a periacetabular zone (Δ seg 1 to 2), where effective diameter and cortical clearance were most limited. Feasibility rates were 100% at 3.5–4.5 mm, 95.2% vs. 82.5% at 5.0 mm, 81.0% vs. 27.5% at 6.5 mm, and 59.5% vs. 10.0% at 7.3 mm in males and females, respectively.
-
Conclusions Female models demonstrated smaller trajectory-wide bottleneck diameters and segment-wise effective diameters than male models. Acetabular-referenced Δ seg realignment identified two reproducible anatomic risk zones: a preacetabular zone adjacent to the obturator neurovascular bundle and a periacetabular zone near the external iliac vessels. At diameters ≥6.5 mm, cortical proximity increased more prominently in females than in males.
-
Level of evidence III.
Introduction
Retrograde superior ramus screw fixation is widely used to stabilize the anterior pelvic ring in superior ramus fractures [1,2]. Compared with open approaches, this technique can be performed through small incisions with limited soft-tissue dissection, which can reduce blood loss and surgical morbidity. It is also increasingly applied to fragility fractures in older patients [2]. However, safe screw placement is constrained by the narrow, irregular, and variably curved intraosseous corridor of the superior ramus [3,4]. Corridor geometry differs by sex and pelvic morphotype, with parameters including the limiting diameter and the available intraosseous trajectory length. These anatomic differences may increase the risk of cortical breach and injury to the acetabular articular cartilage or intrapelvic neurovascular structures [3,4]. The superior ramus screw corridor originates just inferior to the pubic tubercle adjacent to the pubic symphysis and courses through the superior ramus toward the superior acetabular area [5]. In 1995, Routt et al. [6] described retrograde intramedullary fixation for anterior pelvic ring injuries, establishing the corridor as the anatomic basis for percutaneous superior ramus screw techniques.
Anatomic studies describe a double-curved configuration with midcourse angulation, suggesting that both the limiting cross-section and local curvature change along the path [7]. The trajectory follows the superior ramus margin, passes through the anterior acetabular column, and continues toward the sacroiliac tubercle region near the sacroiliac joint [5]. The most constricted region was reported between the iliopsoas gutter and the obturator neurovascular canal [8,9]. The superior isthmus was defined as the distance between the acetabular joint surface and the superior boundary of the corridor [8,9]. The reported measurements differ by the anatomic level at which they are obtained [7,10-12]. These features suggest that screw feasibility is determined primarily by localized constrictions and morphologic variability. Detailed morphometric characterization is needed to guide selection of screw diameter and length to support preoperative planning.
When planning retrograde superior ramus screw insertion, safe accommodation of a screw matched to corridor size requires estimating the minimum intraosseous diameter and the intraosseous trajectory length. Preoperative planning should also localize the segment containing the minimum diameter along the intended trajectory and characterize how the intraosseous diameter changes along the path [7,13-15].
Accordingly, in this cross-sectional, computed tomography (CT)-based morphometric study, we quantified anatomic constraints of the retrograde superior ramus screw corridor along a predefined trajectory using three-dimensional reconstructions. Specifically, we aimed to (1) measure the trajectory-wide minimum intraosseous diameter (D bottleneck) and intraosseous trajectory length, (2) compare these morphometric parameters between male and female pelvic models, and (3) identify the bottleneck segment and characterize the pattern of diameter variation along the trajectory. We hypothesized that the trajectory-wide minimum diameter would be smaller in female models than in male models, whereas intraosseous trajectory length would be similar between sexes.
Methods
This study used anonymized cadaveric pelvic CT datasets provided by the Korea Institute of Science and Technology Information (KISTI). The research involved secondary analysis of deidentified imaging data and did not involve living human participants or identifiable private information. Therefore, Institutional Review Board approval and informed consent were not applicable.
We performed a cross-sectional, CT-based morphometric study of the superior ramus osseous corridor using anonymized cadaveric pelvic CT datasets provided by the KISTI.
This morphometric analysis was conducted from November 2025 to January 2026. The cadaveric pelvic CT datasets were obtained as deidentified secondary data from the Korea Institute of Science and Technology Information (KISTI), and the original CT acquisition/collection dates were not available in the provided dataset.
Exposures included sex, injury side (left or right hemipelvis), and pelvic morphology (shape and structure of the pelvis). Primary outcome measures were the minimum bottleneck diameter (narrowest screw pathway) and screwable length (maximum length in bone for a screw) of the retrograde superior pubic ramus screw corridor. Secondary safety outcomes were segment-wise cortical clearance in the preacetabular (Δ seg −6 to −4, in front of the hip socket) and periacetabular (Δ seg 1–2, near the hip socket) zones. This was defined as the minimum perpendicular distance from the virtual screw surface to the cortical boundary (outer bone edge) at each cross-sectional plane.
We screened pelvic CT scans from 105 adult cadavers and excluded those with pelvic pathology based on medical record review or imaging, such as retained hardware, deformity from a prior fracture, or suspected osseous tumor, as well as scans with image quality insufficient for reliable three-dimensional reconstruction and measurement. Twenty-three cadavers met these exclusion criteria, leaving 82 cadavers (42 males and 40 females) for analysis. The mean age was 52.1 years (standard deviation [SD], 9.2; range, 21–60 years) and the mean height was 161.3 cm (SD, 7.1; range, 146–176 cm).
All cadavers underwent supine CT scanning with a 1.0-mm section thickness (Pronto [Hitachi, Tokyo, Japan]). CT data in Digital Imaging and Communications in Medicine (DICOM) format were imported into Mimics (Materialise, Leuven, Belgium) to reconstruct three-dimensional pelvic models including the sacrum and both iliac bones. Using Mimics, we simulated pelvic radiographic projections, including pelvic anteroposterior (AP), inlet, outlet, and obturator oblique outlet views, to center the virtual cylinder within the intraosseous corridor while avoiding cortical violation and virtually placed a retrograde superior ramus screw trajectory (Fig. 1).
After initial virtual cylinder placement, an experienced pelvic trauma surgeon (KTK) adjusted and verified the entry point and trajectory using standardized multiplanar reconstructions and fluoroscopic-equivalent views. The trajectory originated at an osseous entry point inferior to the pubic tubercle and lateral to the symphyseal meniscus and was directed toward the lateral iliac cortex above the acetabulum to represent the intended superior ramus corridor [6]. Corridor boundaries were defined by the surrounding cortices of the superior ramus (medial [inner], lateral [outer], superior, and inferior). In the periacetabular region, boundaries were defined by the supracetabular cortex superiorly, the quadrilateral plate cortex medially, the acetabular surface inferiorly, and the anterior wall of acetabulum laterally (Fig. 2).
To quantify the intraosseous diameter of the retrograde ramus screw corridor, we defined two morphometric outcomes, including the trajectory-wide bottleneck diameter and the corresponding corridor cylinder length. A virtual cylinder representing the screw was aligned with the predefined trajectory to avoid cortical violation and evaluated uniformly across all models.
The cylinder diameter was incrementally increased until the cylinder first contacted the cortical boundary at any point along the trajectory. For each pelvis, the largest cylinder diameter that remained fully contained within the corridor along the entire path was recorded as the bottleneck, representing the trajectory-wide maximum allowable diameter. The corresponding cylinder length was defined as the intraosseous distance along the trajectory from the proximal entry point to the distal endpoint (Fig. 3).
To characterize local corridor geometry along the trajectory, we resliced each pelvic model into orthogonal cross-sections at 9.5-mm intervals along the cylinder axis, generating sequential segments from the entry region to the distal endpoint at the lateral iliac cortex (maximum of 12 segments per model). This spacing was selected a priori as a pragmatic compromise between spatial resolution and measurement reproducibility and burden across models, providing approximately 1-cm sampling and a manageable number of cross-sections over the typical corridor length (approximately 120–130 mm). This sampling density is sufficient to capture clinically interpretable regional trends while limiting excessive multiplicity from very fine reslicing by reducing the number of segment-level comparisons. (Fig. 4).
At each segment, the perpendicular distances from the cylinder centerline to the surrounding cortical boundaries were measured in four directions (medial, lateral, superior, and inferior). The segment-wise limiting radius (r min, seg) was defined as the minimum of the four perpendicular distance: r min, seg=min (d medial, d lateral, d superior, d inferior). The effective corridor diameter at each segment was defined as D eff, seg=2r min, seg, representing the maximum cylinder diameter accommodated at that segment without cortical violation assuming a fixed trajectory axis. For the segment-wise analysis, segments were numbered 1‒12 in a sequential order along the trajectory, from entry-side to the distal endpoint. To quantify the segment-specific diameter margin relative to the bottleneck diameter, we defined segment-wise cortical clearance (Clearanceseg) as a diameter-based difference between the segment-wise effective corridor diameter (D eff, seg) and the trajectory-wide bottleneck diameter (D bottleneck): Clearance seg=D eff, seg–D bottleneck. Clearance seg=0 at the bottleneck segment. Values greater than 0 indicate segments in which D eff, seg exceeds D bottleneck. We defined the acetabular start segment (ASS) as the segment immediately preceding the acetabular dome along the trajectory and used it to divide the corridor into the preacetabular and periacetabular regions. All measurements followed a prespecified protocol with fixed intersegment interval and standardized cortical boundary definitions. The corresponding author independently reviewed trajectory placement to ensure consistent application of the protocol.
To standardize comparisons across models by aligning segment numbers to a consistent anatomic landmark, we referenced segment position to the ASS using a segment-offset variable (Δ seg), calculated by subtracting the acetabular segment number from the segment. For each model, we defined the ASS as the first segment in which the acetabular articular surface formed the inferior corridor boundary. Δ Seg was defined as 0 at ASS. Negative values indicate preacetabular (proximal) segments toward the entry point, whereas positive values indicate periacetabular (distal) segments along the trajectory toward the lateral ilium, where acetabular involvement contributes to the inferior corridor boundary (Fig. 5).
Interobserver reliability was assessed in a representative subset of 20 models that were independently processed by two observers using the same prespecified protocol for trajectory planning, ASS identification, and morphometric derivation. Reliability was quantified using the intraclass correlation coefficient (ICC), specifically a two-way random-effects model with absolute agreement for single measurements (ICC [2,1]) and was reported with 95% confidence intervals (CIs).
Feasibility was assessed for five prespecified cylinder diameters (3.5, 4.5, 5.0, 6.5, and 7.3 mm) to reflect commonly used implant sizes. For each diameter, models were classified as feasible if the model-level bottleneck diameter was greater than or equal to the threshold diameter.
All measurements were performed using a prespecified protocol with fixed segment spacing and standardized cortical boundary definitions. Trajectory placement was independently reviewed by the corresponding author to ensure measurement consistency.
We applied several steps to mitigate potential bias. Trajectory definition, intersegment interval, and boundary measurements followed a prespecified protocol applied uniformly to all models (Fig. 6). When minor trajectory adjustments were required, such adjustments were restricted to refinements within the same anatomic entry region and were verified by the corresponding author. During measurement, sex information was concealed to minimize sex-related observer bias.
Sample size was determined by the number of eligible cadaveric pelvic CT datasets available during the study period. No a priori sample size calculation was performed for the present morphometric analysis.
Continuous variables (D bottleneck, cylinder length, D eff, seg, and Clearance seg; all in millimeters) were presented as mean±SD, and categorical outcomes were presented as counts and percentages. Sex was the primary grouping variable. Global outcomes (D bottleneck and cylinder length) were compared between males and females using 2-sample t-tests; the Welch t-test was used when the equal-variance assumption was not met. Effect sizes were reported as mean differences with 95% CIs. Sex differences in segment-wise outcomes (D eff, seg, and Clearance seg) were evaluated using independent 2-sample t-tests at each segment and at each Δ seg position relative to acetabular start, with multiplicity control across segment-wise comparisons using the Benjamini-Hochberg false discovery rate (FDR) procedure. Segment-wise and Δ seg measurements are repeated observations within each pelvis; therefore, adjacent segments are anatomically correlated and not statistically independent. Accordingly, these analyses are intended to describe spatial patterns along the corridor rather than to support segment-specific causal inference, and P-values should be interpreted cautiously. Sex differences in feasibility were evaluated using the Fisher exact test; effect sizes are reported as risk ratios with 95% CIs. To account for multiple comparisons across the prespecified cylinder diameters (3.5, 4.5, 5.0, 6.5, and 7.3 mm), feasibility analyses used Benjamini-Hochberg FDR-adjusted P-values. Distributional assumptions were evaluated visually using the line plots used for data visualization. Statistical analyses and development of graphs were performed using R ver. 4.4.3 (R Foundation for Statistical Computing).
Results
Interobserver reliability was high in the subset of 20 models. ASS identification showed complete agreement (ICC, 1.00; weighted κ, 1.00). Continuous measures were highly reproducible, with ICC values of 0.980 (95% CI, 0.952–0.992) for cylinder length and 0.962 (95% CI, 0.907–0.985) for bottleneck diameter (Supplementary Table 1).
In this study, 82 pelvic models were analyzed, including 42 male and 40 female models. The mean model-level bottleneck diameter was larger in males than in females, with mean values of 7.34±1.10 mm in males and 5.93±0.98 mm in females, for a mean difference of 1.41 mm. Mean cylinder length was similar between sexes, averaging 127.85±8.54 mm in males and 128.85±8.20 mm in females, for a mean difference of −1.00 mm (Supplementary Table 2). All included models yielded complete measurements, and no imputation was performed. Sensitivity analyses were consistent with the primary results (Supplementary Table 3).
Segment-wise effective corridor diameters were compared between sexes across 12 predefined segments. Effective diameters were larger in males than in females in segments 2 through 11. This pattern suggested sex differences across most of the trajectory. The largest sex difference was observed at segment 11. In males, the mean segment-wise effective diameter ranged from 8.14±1.45 mm at segment 4 to 17.34±5.21 mm at segment 12. The diameter decreased to the minimum at segment 4. This was followed by an increase to approximately 11 mm at segments 6 and 7. The diameter subsequently decreased again to approximately 9 mm across segment 8 through 10. The diameter increased at segment 11 and peaked at segment 12. In females, the mean effective diameter ranged from 6.77±1.35 mm at segment 10 to 13.59±2.57 mm at segment 12. The diameter decreased through segment 4. This was followed by a gradual increase across segment 5 through 7 with a local maximum at segment 7. The diameter then decreased to the minimum at segment 10. The largest increase occurred between segments 11 and 12. The diameter reached the maximum at segment 12 (Fig. 7, Supplementary Table 4).
Segment-wise cortical clearance used as a safety margin was compared between sexes across 12 segments. Sex differences were identified in 5 of 12 segments. These were segments 1, 6, 7, 8, and 11. At segment 1, females had greater cortical clearance than males. Mean clearance was 2.55±2.11 mm in females and 1.51±1.35 mm in males. In contrast, males had greater clearance at segment 6, 7, 8 and 11. No sex differences were detected in segment 2 through 5, 9, 10 or 12. In males, cortical clearance ranged from 0.80±0.99 mm at segment 4 to 9.67±4.81 mm at segment 12. The pattern decreased to a minimum at segment 4. This was followed by a mid-trajectory increase with mean clearance of approximately 3 to 4 mm across segments 6 through 8. Clearance then declined across segments 9 and 10 to approximately 1 to 2 mm. A distal increase followed that began at segment 11 and peaked at segment 12. In females, cortical clearance ranged from 0.86±1.14 mm at segment 10 to 7.59±2.54 mm at segment 12. The trajectory decreased through segment 4. This was followed by a mid-trajectory increase with a local peak near segment 7 with mean clearance of approximately 2 to 3 mm. Clearance then declined to minimum at segment 10. The largest increase occurred between segments 11 and 12. Clearance peaked at segment 12 (Fig. 8, Supplementary Table 5).
After realignment to the acetabular transition segment Δ seg 0, effective corridor diameters were presented by sex at each relative segment using all available measurements. Statistical comparisons were performed only at Δ seg positions with adequate sex-specific sample sizes. Positions with insufficient data in either sex were presented descriptively. No sex difference was observed at Δ seg −7. From Δ seg −6 through Δ seg 3, males had larger effective diameters than females. In both sexes, effective diameter was larger in the preacetabular segments and decreased toward and immediately after acetabular start. The narrowest region occurred around Δ seg 1 to 2. Distally, the corridor increased again at Δ seg 3. The increase was more pronounced in males. When segment position was referenced to acetabular start (Δ seg), males showed a gradual preacetabular narrowing toward Δ seg −4. This was followed by a marked periacetabular expansion from Δ seg −2 through Δ seg 0. The profile then narrowed in the periacetabular region from Δ seg 1 through Δ seg 2 and expanded distally at Δ seg ≥3. In females, the profile showed a gradual preacetabular narrowing toward Δ seg −4. A slight expansion was observed from Δ seg −2 through Δ seg −1. The trajectory then narrowed from Δ seg 0 through Δ seg 2. The minimum occurred at Δ seg 2. The trajectory increased again at Δ seg 3 (Fig. 9, Supplementary Table 6).
After realignment to Δ seg 0, cortical clearance as a safety margin was reported by sex at each relative segment using all available measurements. Males had significantly greater cortical clearance than females at Δ seg −2, Δ seg −1, Δ seg 0, and Δ seg 1. No significant differences were detected from Δ seg −7 through Δ seg −3 or from Δ seg 2 through Δ seg 3. When segment position was referenced to acetabular start (Δ seg), males showed an initial decrease in cortical clearance toward a local minimum at Δ seg −4. This was followed by a marked periacetabular increase from Δ seg −2 through Δ seg 0. Clearance then decreased in the periacetabular region from Δ seg 1 through Δ seg 2. A second low point occurred at Δ seg 2. Clearance increased distally at Δ seg ≥3 and reached the largest values at Δ seg 4. In females, clearance decreased gradually from Δ seg −8 toward Δ seg −4. A slight periacetabular increase occurred from Δ seg −2 through Δ seg −1. Clearance then decreased from Δ seg 0 through Δ seg 2 and reached the minimum at Δ seg 2. Clearance increased distally at Δ seg 3 (Fig. 10, Supplementary Table 7).
Bottleneck locations at more proximal positions (Δ seg −7 to −5) and at Δ seg 0 or 3 were uncommon. At shared Δ seg positions, mean bottleneck diameters were generally larger in males than in females. At the most common bottleneck location (Δ seg 2), the mean bottleneck diameter was 7.54±0.96 mm in males (n=16) and 6.27±1.08 mm in females (n=12). Several Δ seg positions had small sample sizes, including cells with n=1 in one sex. Bottleneck location occurred most frequently at specific Δ seg positions in both sexes. In males (n=42), the bottleneck most frequently occurred at Δ seg 2 (16/42, 38.1%), followed by Δ seg −4 (7/42, 16.7%) and Δ seg 1 (4/42, 9.5%). In females (n=40), the bottleneck most frequently occurred at Δ seg 2 (12/40, 30.0%), followed by Δ seg −3 (7/40, 17.5%) and Δ seg 1 (6/40, 15.0%) (Fig. 11, Supplementary Table 8).
Feasibility for accommodating a virtual cylinder was evaluated at five diameters of 3.5 mm, 4.5 mm, 5.0 mm, 6.5 mm, and 7.3 mm. All models were feasible for a 3.5 mm and 4.5 mm, including 42 of 42 male models and 40 of 40 female models. At 5.0 mm, feasibility remained 95.2% in males, with 40 of 42 models feasible, and decreased to 82.5% in females, with 33 of 40 models feasible. At larger diameters, feasibility declined and differed by sex. At 6.5 mm, feasibility was 81.0% in males, with 34 of 42 models feasible, and 27.5% in females, with 11 of 40 models feasible (P<0.001). At 7.3 mm, feasibility was 59.5% in males, with 25 of 42 models feasible, and 10.0% in females, with 4 of 40 models feasible (P<0.001) (Fig. 12, Supplementary Table 9).
Among models classified as infeasible at a given diameter, the primary cortical breach occurred at the bottleneck segment. When breach locations were grouped into clinically defined Δ seg regions, females most frequently breached in the periacetabular zone (Δ seg 1 to 2) at both 6.5 mm (13/29, 44.8%) and 7.3 mm (16/36, 44.4%). In contrast, males showed a higher proportion of preacetabular breaches at 7.3 mm (9/17, 52.9%). Regarding the breached cortical boundary, superior-boundary breaches predominated in females at 6.5 mm (14/29, 48.3%) and 7.3 mm (17/36, 47.2%) In males, boundary involvement was variable at 6.5 mm, whereas at 7.3 mm the inner boundary was most frequently breached (6/17, 35.3%). Small sample size counts limited inference at 5.0 mm, particularly in males (n=2), in whom breaches were evenly split between preacetabular and distal periacetabular locations and between superior and outer boundaries (each 50%). The distribution of breached cortical boundaries and location did not differ significantly by sex within each diameter (Supplementary Table 10).
The full numeric values, sex-specific sample sizes, and corresponding test statistics for all segment-wise and Δ seg analyses are provided in Supplementary materials.
Discussion
In this cross-sectional CT morphometric study, we identified clinically meaningful sex differences in the retrograde superior ramus screw corridor. Female models had smaller corridor diameter along the trajectory than male models, with smaller segment-wise effective diameters and a smaller model-level bottleneck diameter. These morphometric differences had clinically relevant implications for diameter-dependent feasibility. Feasibility was universal at 3.5 mm and 4.5 mm diameters in both sexes but decreased markedly at 6.5 mm and 7.3 mm, with a greater relative decline in females.
Interpretation/comparison with previous studies
Our findings are consistent with prior CT-based morphometric studies showing that narrowest canal diameter is larger in males than in females [5,7,12,14]. Similarly, the marked decline in female feasibility at screw diameters ≥6.5 mm aligns with a large CT morphometric study (n=231) reporting that 6.5 mm and 7.3 mm screws may not be safely accommodated in a substantial proportion of female patients [15]. Taken together, these findings provide practical guidance for screw diameter selection along the trajectory.
A key strength of our approach is that it localizes constrictions along the entire trajectory rather than at a single anatomic cross-section. We resliced a series of orthogonal cross-sections at 9.5 mm intervals along the selected cylinder centerline and calculated the segment-wise effective diameter as twice the minimum distance from the centerline to any cortical boundaries. The minimum effective diameter across the trajectory defined the model-level bottleneck. We also quantified segment-wise cortical clearance as the minimum residual distance between the cylinder surface and the nearest cortical boundaries. This clearance served as the safety margin. This combined description of corridor diameter and safety margin is clinically useful. A segment may accommodate a given screw diameter but provide minimal safety margin to the cortex, increasing the risk of cortical violation if intraoperative trajectory adjustments are required. Therefore, our analysis provides both the spatial variation in corridor diameter along the superior ramus trajectory and, for each segment, the cortical boundary most susceptible to violation.
Our feasibility thresholds were derived from intact cadaveric pelves along a prespecified, idealized trajectory and therefore represent an idealized anatomic corridor. In clinical superior ramus fractures, displacement, residual malreduction, and limitations of intraoperative fluoroscopy may alter corridor geometry, narrowing the usable diameter and shifting the location of the limiting segment. Therefore, the reported thresholds should be interpreted as an anatomic reference rather than fixed intraoperative cutoffs for displaced fractures.
The segment numbers (Seg 1–12) may not correspond to anatomically comparable locations across individuals because the acetabular articular surface begins at variable positions. Accordingly, we realigned segment position to the ASS (Seg ASS) using a relative coordinate (Δ seg=Seg–Seg ASS). Using segment numbering, both effective diameter and cortical clearance (safety margin) showed a nonmonotonic profile with two constriction zones. The first zone was a proximal constriction (Seg 2–4), and the second zone was a periacetabular constriction (Seg 9–10). After realignment to acetabular start, these zones were standardized as a preacetabular zone (Δ seg −6 to −4; Seg 2–4) and a periacetabular zone (Δ seg 1 to 2; Seg 9–10). These findings suggest that anchoring segment position to the ASS improves consistency in identifying anatomically corresponding bottleneck sites along the corridor.
Sex-specific patterns were observed within these acetabular-referenced intervals. In the preacetabular segments (Δ seg −6 to −4), the greatest male constriction was at Δ seg −4, followed by Δ seg −6. Females also showed narrowing at Δ seg −4 and Δ seg −5. In the periacetabular zone (Δ seg 1 to 2), both sexes exhibited concurrent decreases in diameter and safety margin, but the decreases were greater in females. These findings identify the segment immediately distal to the acetabular start as a clinically important risk zone, particularly in females, where both corridor diameter and safety margin decrease most markedly.
Diameter-specific feasibility represented the clinical impact of these morphometric differences. Feasibility was universal at 3.5 mm and 4.5 mm in both sexes but decreased markedly at larger diameters, especially in females. Males were approximately three times more likely to accommodate a 6.5-mm cylinder than females, and nearly six times more likely to accommodate a 7.3-mm cylinder. These results suggest that the safety margin may be limited when selecting screws ≥6.5 mm in females and support patient-specific, corridor-based preoperative planning for screw diameter selection.
Failure patterns differed by sex and diameter in both Δ seg location and the dominant limiting cortical boundary. At 6.5 mm, most failures occurred in females (29/37). In females, failures clustered immediately after acetabular start (Δ seg 1 to 2) and were most often limited by the superior cortex, accounting for approximately half of infeasible cases at 6.5 mm and 7.3 mm. A second female cluster was observed in the entry-side preacetabular range (Δ seg −6 to −5). These models had smaller bottleneck diameters and showed a shift in dominant limiting boundary from the superior cortex to the medial-lateral cortices (inner/outer). Male failures at 6.5 mm were irregular and were distributed across Δ seg without a single dominant boundary phenotype. At 7.3 mm, failures remained largely female, with persistent clustering at Δ seg 2 and predominantly superior-boundary limitation. In contrast, males demonstrated an additional cluster centered around Δ seg −4 that was characterized by medial-boundary limitation. Overall, these patterns suggest sex-specific failure patterns, with periacetabular superior-boundary limitation more prominent in females and proximal medial-boundary limitation more evident in males.
The retrograde superior ramus screw corridor lies close to major neurovascular structures, including the obturator neurovascular bundle and the external iliac vessels [14]. In this CT-based morphometric study, we modeled the osseous corridor only along a standardized trajectory; therefore, our findings do not quantify clinical neurovascular risk, which is additionally influenced by soft-tissue anatomy, fracture displacement and reduction, and intraoperative conditions. However, cortical contact with, or breach of, specific corridor boundaries may be anatomically relevant when interpreting where a larger-diameter screw is most constrained. For screws ≥6.5 mm, infeasible male models more frequently demonstrated medial-boundary limitation in the preacetabular region, whereas infeasible female models more frequently demonstrated superior-boundary limitation in the periacetabular region. These boundary-specific patterns are consistent with prior anatomic descriptions placing the obturator neurovascular bundle approximately 36–44 mm lateral to the pubic symphysis and 2–4 mm posterior to the superior ramus, and the external iliac vessels approximately 63–73 mm lateral and 3–8 mm posterior [16]. These landmark ranges broadly correspond to our preacetabular (Δ seg −6 to −4) and periacetabular (Δ seg 1 to 2) intervals. Accordingly, our results should be viewed as hypothesis-generating anatomic context that may help prioritize direction-specific corridor assessment in these Δ seg zones during preoperative planning, rather than as evidence of segment-level or sex-specific neurovascular injury risk.
Minor intraoperative deviations in the entry point or trajectory may materially influence both bottleneck location and safety margins because the corridor is narrow, irregular, and curved. Even small angular changes can disproportionately affect the periacetabular portion of the trajectory, where cortical boundaries are closely apposed. These deviations may shift the limiting segment and reduce cortical clearance, even when the idealized intact-model corridor appears adequate. Therefore, our segment-wise bottleneck mapping should be viewed as trajectory dependent and is most applicable when the planned trajectory closely matches the prespecified trajectory.
Our study has several limitations. First, the effective diameter and cortical clearance reported in this study were trajectory dependent and were determined along a single prespecified path. Therefore, our diameter thresholds should not be used as fixed intraoperative cutoffs. Instead, they should be interpreted as morphology-based reference values and confirmed on a patient-specific basis when substantial trajectory modification is required. Second, as a morphometric analysis, our study did not account for fracture displacement, reduction, or intraoperative imaging constraints. Accordingly, feasibility estimates for specific screw diameters in displaced superior ramus fractures may differ and should be interpreted as morphology-based, exploratory reference values rather than definitive clinical thresholds. Third, our cadaveric cohort had a relatively young mean age, 52.1 years (SD, 9.2; range, 21–60 years), compared with the typical fragility-fracture population in whom minimally invasive anterior ring fixation, including retrograde superior ramus screws, is commonly considered. Age-related changes may influence absolute corridor dimensions and, importantly, bone quality in ways not captured by morphology alone; therefore, the feasibility proportions and suggested diameter thresholds reported here may not directly translate to older, osteoporotic patients. Nonetheless, we expect the observed sex-related patterning of constriction zones to remain directionally informative for anatomic risk mapping. Future validation in geriatric cohorts with osteoporosis, ideally incorporating bone quality metrics, is warranted before clinical generalization. Fourth, our segment-wise and acetabular-referenced (Δ seg) analyses are based on repeated measurements obtained within the same pelvis; therefore, values from contiguous segments are anatomically correlated and not statistically independent. Although we controlled multiplicity across segment-level comparisons using the Benjamini-Hochberg FDR procedure, this adjustment does not address within-pelvis correlation. Accordingly, segment-level P-values should be interpreted cautiously, and these analyses should be viewed primarily as descriptive topographic mapping of spatial patterns (narrowing and cortical clearance) along the corridor rather than as evidence supporting segment-specific causal inference. Future studies may incorporate correlation-aware approaches, such as mixed-effects or marginal models, to strengthen segment-level inference while preserving spatial resolution. Fifth, segment-wise effective diameter was computed from four orthogonal centerline-to-cortex distances on each cross-section. Because the true minimum distance may occur along an oblique direction in nonelliptical or irregular corridor shapes, our approach may not capture the strict minimum in every segment and could modestly overestimate D eff, seg and the corresponding clearance in some locations.
In this cross-sectional CT-based morphometric study, we identified clinically meaningful sex-specific differences in the retrograde superior ramus screw corridor. Female models had a smaller trajectory-wide bottleneck diameter and smaller segment-wise effective diameters than male models, whereas intraosseous trajectory length was comparable between sexes. After acetabular-referenced realignment (Δ seg), we identified two constriction zones, including a preacetabular narrowing (Δ seg −6 to −4) and a periacetabular risk zone (Δ seg 1 to 2). In these zones, corridor capacity and cortical clearance, a segment-level safety margin, were lowest, most prominently in females. These constraints translated into diameter-dependent feasibility. Cylinders of 3.5 mm and 4.5 mm were feasible in most models in both sexes, whereas feasibility decreased substantially at 6.5 mm and 7.3 mm, with a greater decline in females. Because these estimates are trajectory dependent and derived from intact pelvic models rather than clinical outcome data, and because pelvic morphology varies across populations, the results should be generalized cautiously.
-
Author contributions
Conceptualization: JWJ, JTA, GHJ, KTK. Data curation: JTA. Formal analysis: JWJ, JTA. Investigation: GHJ. Resources: GHJ. Visualization: JWJ, GHJ, KTK. Writing–original draft: JWJ. Writing–review & editing: JWJ, JTA, GHJ, KTK. All authors read and approved the final manuscript.
-
Conflicts of interest
No potential conflict of interest relevant to this article was reported.
-
Funding
None.
-
Data availability
Restrictions apply to the availability of these data. The human body digital datasets were obtained from the Korea Institute of Science and Technology Information and are available upon reasonable request with the permission of Korea Institute of Science and Technology Information.
-
Acknowledgments
None.
Article Information
Supplementary materials
Supplementary materials related to this article can be found online at https://doi.org/10.12671/jmt.2026.00066.
Supplementary Table 1.
Interobserver reliability for acetabular start segment identification and key morphometric measures
Supplementary Table 2.
Bottleneck diameter and planned cylinder length by sex
Supplementary Table 3.
Sensitivity analyses of sex differences in global corridor outcomes
Supplementary Table 4.
Segment-wise effective diameter by sex across 12 segments
Supplementary Table 5.
Segment-wise cortical clearance (safety margin) by sex across 12 absolute segments
Supplementary Table 6.
Segment-wise effective diameter by sex after realignment to acetabular start (Δ seg)
Supplementary Table 7.
Segment-wise cortical clearance (safety margin) by sex after realignment to acetabular start (Δ seg)
Supplementary Table 8.
Bottleneck diameter by acetabular start segment (Δ seg)
Supplementary Table 9.
Infeasibility rates by cylinder diameter and relative risk of infeasibility (male vs. female)
Supplementary Table 10.
Dominant failure pattern in infeasible models (by diameter and sex)
Fig. 1.

Virtual cylinder positioning and biomechanical orientation. (A) Pelvis anteroposterior view. (B) Pelvis inlet view. (C) Obturator oblique outlet view. (D) Outlet view.
Fig. 2.

Corridor boundaries in the preacetabular and periacetabular regions. In the three-dimensional hemipelvis model, yellow dots delineate the boundaries of the preacetabular zone: the lateral (A) and medial (B) margins on the inlet view, the superior margin on the obturator oblique outlet (OOO) view (C), and the inferior margin (D). Corresponding boundaries of the periacetabular zone include the lateral (E) and medial (F) margins on the inlet view, the superior margin on the OOO view (G), and the inferior margin (H).
Fig. 3.
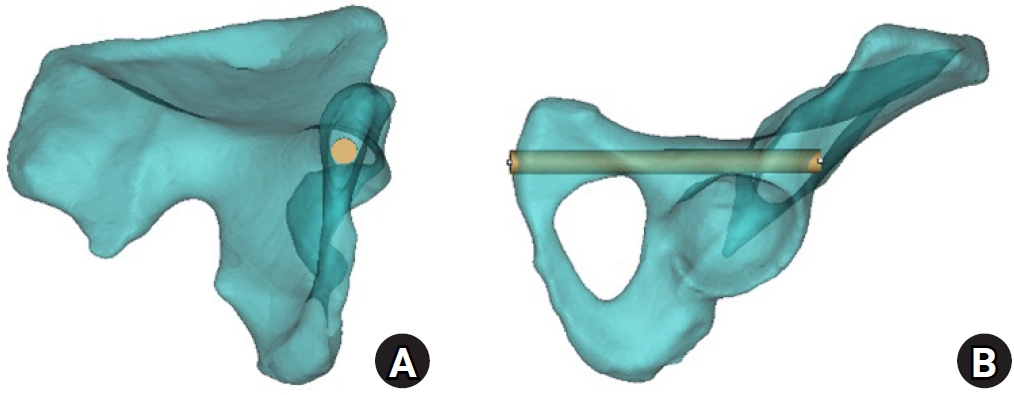
Axial cylinder and obturator oblique outlet views for measurement of bottleneck diameter and intraosseous corridor length. (A) On the axial cylinder view, the superior ramus screw corridor was assessed, and the bottleneck diameter was measured as the largest cylinder diameter that could be accommodated without cortical violation. (B) On the obturator oblique outlet view, the total cylinder length was measured to define the intraosseous corridor length.
Fig. 4.

Corridor boundaries in the preacetabular and periacetabular zones on resliced computed tomography (CT) images. The three-dimensional hemipelvis model and corresponding resliced CT images illustrate the spatial correspondence of each corridor boundary. (A–D) CT images demonstrate the medial, lateral, superior, and inferior margins of the preacetabular zone. (E–H) CT images demonstrate the medial, lateral, superior, and inferior margins of the periacetabular zone. Yellow dots indicate corridor boundaries, and orange circles indicate the virtual cylinder.
Fig. 5.

Acetabular-referenced Δ seg analysis. Using acetabulum-referenced alignment, effective corridor diameter (D eff, seg) and cortical clearance (clearance seg) were calculated at each Δ seg position using all available measurements. Bottleneck frequency was defined as the number and percentage of pelvises in which the bottleneck occurred at each Δ seg position.
Fig. 6.
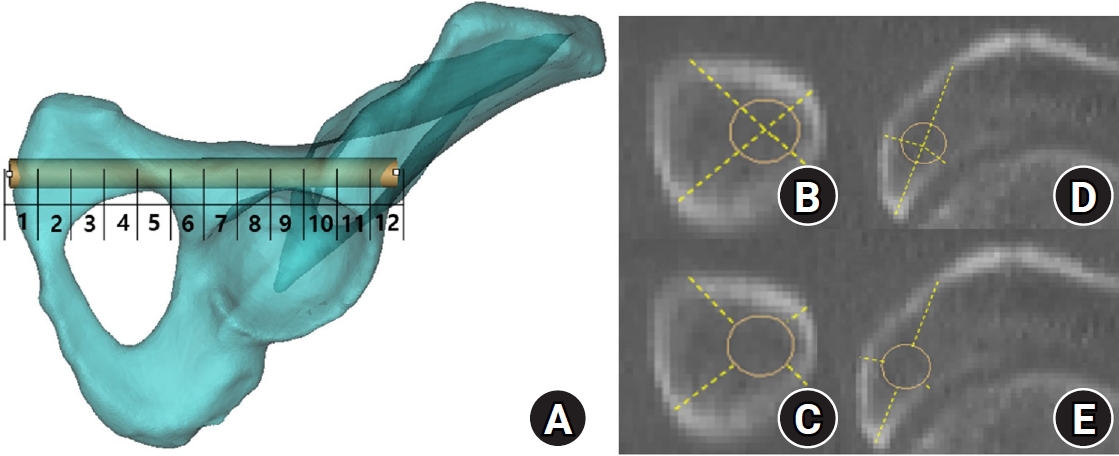
Segment numbering and distance measurements for segment-wise corridor assessment. (A) In the three-dimensional hemipelvis model, the obturator oblique outlet view illustrates division of the corridor into up to 12 segments from the entry point to the distal lateral iliac cortex, with segments numbered sequentially; segment 8 was designated as the acetabular start segment. In the preacetabular region (proximal to the acetabular start segment), (B) effective distance was defined as the minimum perpendicular distance from the cylinder centerline to each cortical boundary, and (C) cortical clearance was defined as the minimum perpendicular distance from the cylinder surface to each cortical boundary. In the periacetabular region (distal to the acetabular start segment), (D) effective distance and (E) cortical clearance were defined analogously. All segment definitions and boundary measurements were performed according to a prespecified protocol uniformly applied across models.
Fig. 7.
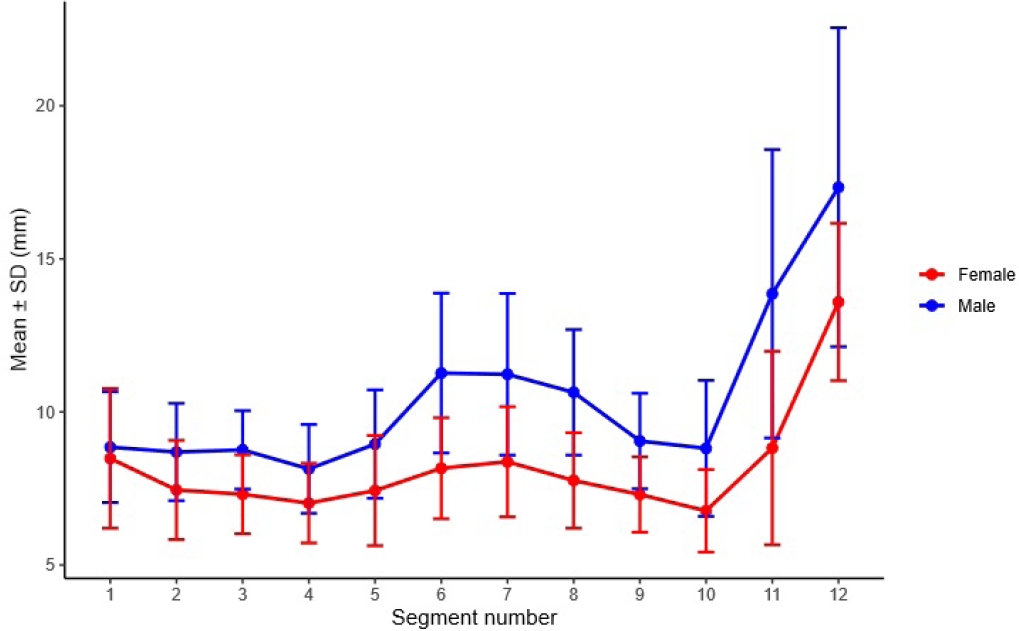
Segment-wise effective diameter by sex across 12 segments. Between-sex comparisons were performed using independent-samples t-tests, and P-values were adjusted using the Benjamini-Hochberg false discovery rate for 12 segment-wise comparisons. Sex differences were significant for segments 2–11 (all P_FDR<0.001) but not for segments 1 or 12 (P_FDR=0.423 and 0.123, respectively). SD, standard deviation.
Fig. 8.
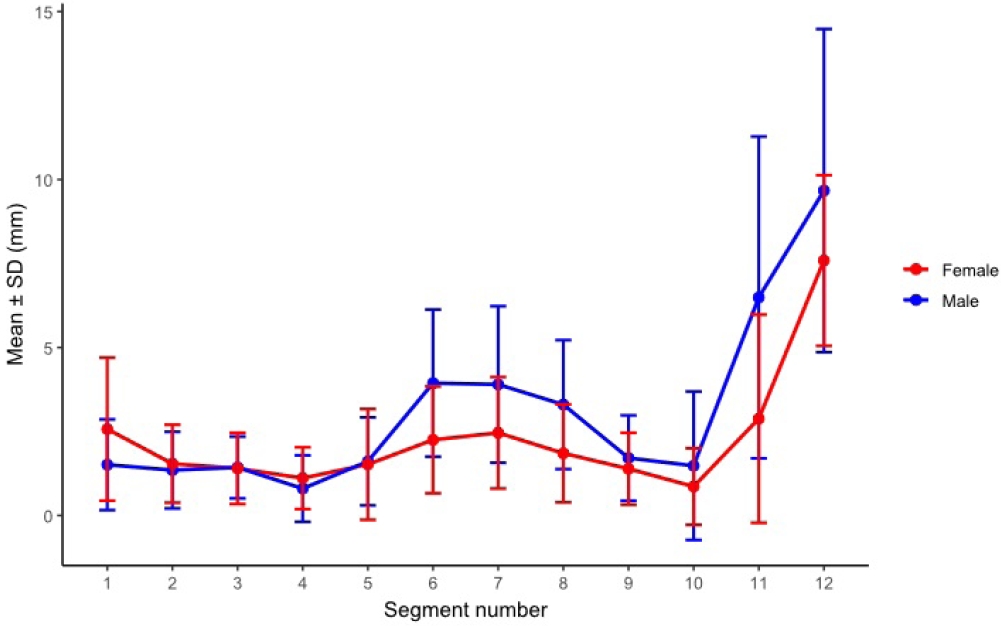
Segment-wise cortical clearance (safety margin) by sex across 12 absolute segments. Sex-based differences were significant in segments 1, 6, 7, 8, and 11 (P_FDR=0.0249, 0.00095, 0.00458, 0.00095, and 0.00133, respectively) and were not significant in the remaining segments (all P_FDR ≥0.203). SD, standard deviation; FDR, false discovery rate.
Fig. 9.

Segment-wise effective diameter by sex after realignment to the acetabular start segment (Δ seg). No sex-based difference was detected at Δ seg −7 (P_FDR=0.282), whereas males exhibited larger effective diameters than females from Δ seg −6 through Δ seg 3 (all P_FDR≤0.00369). SD, standard deviation; FDR, false discovery rate.
Fig. 10.
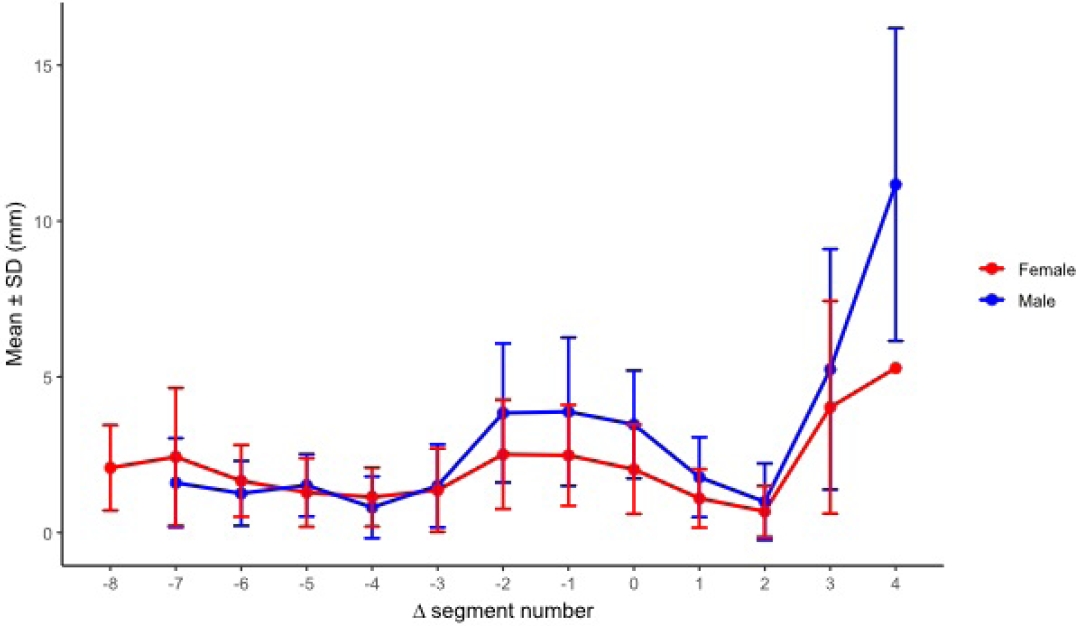
Segment-wise cortical clearance (safety margin) by sex after realignment to the acetabular start segment (Δ seg). Males demonstrated greater cortical clearance at Δ seg −2, −1, 0, and 1 (P_FDR=0.0107, 0.0107, 0.000664, and 0.0131, respectively), whereas no significant sex-based differences were observed at other Δ seg levels with adequate sample size. SD, standard deviation; FDR, false discovery rate.
Fig. 11.

Bottleneck location frequency and diameter by sex after realignment to the acetabular start segment (Δ seg). The distribution of bottleneck locations across relative segments (Δ seg −7 to 3) did not differ by sex (Fisher exact test with Monte Carlo simulation, P=0.461). Within Δ seg positions, the most pronounced sex-based difference in bottleneck diameter was observed at Δ seg 2 (Welch t-test P=0.0038; Benjamini-Hochberg FDR-adjusted P=0.023), whereas nominal differences at Δ seg −5 and 1 did not remain significant after FDR correction. SD, standard deviation; FDR, false discovery rate.
Fig. 12.
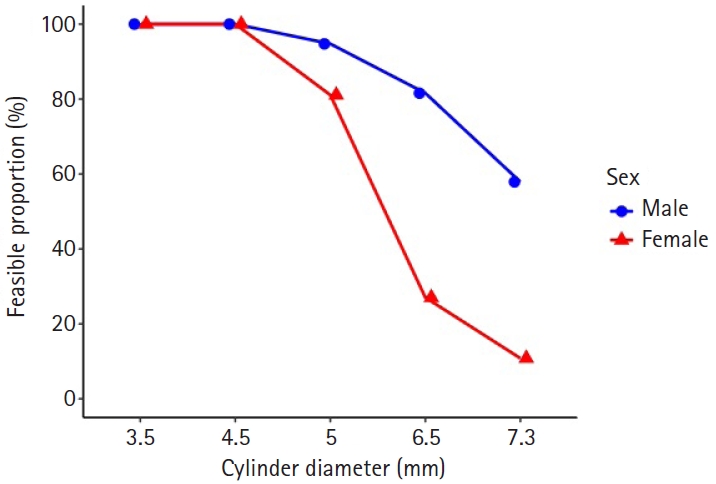
Diameter-dependent feasibility by sex. Proportion of pelvis models accommodating the cylinder diameter along the retrograde superior pubic ramus trajectory. Feasibility was 100% at 3.5–4.5 mm in both sexes, declined at 5.0 mm (male 95.2% vs. female 82.5%; P_FDR=0.084), and showed significant sex differences at 6.5 mm (81.0% vs. 27.5%) and 7.3 mm (59.5% vs. 10.0%). FDR, false discovery rate.
- 1. Heiman E, Gencarelli P Jr, Tang A, Yingling JM, Liporace FA, Yoon RS. Fragility fractures of the pelvis and sacrum: current trends in literature. Hip Pelvis 2022;34:69-78.ArticlePubMedPMCPDF
- 2. Wilson DG, Kelly J, Rickman M. Operative management of fragility fractures of the pelvis: a systematic review. BMC Musculoskelet Disord 2021;22:717.ArticlePubMedPMCPDF
- 3. Arand C, Wagner D, Richards RG, et al. Anatomical evaluation of the transpubic screw corridor based on a 3D statistical model of the pelvic ring. Sci Rep 2021;11:16677.ArticlePubMedPMCPDF
- 4. Rommens PM, Graafen M, Arand C, Mehling I, Hofmann A, Wagner D. Minimal-invasive stabilization of anterior pelvic ring fractures with retrograde transpubic screws. Injury 2020;51:340-6.ArticlePubMed
- 5. De Bondt S, Carette Y, van Lenthe GH, Herteleer M. Evaluation of the superior pubic ramus and supra acetabular corridors using statistical shape modelling. Surg Radiol Anat 2024;46:1189-97.ArticlePubMedPDF
- 6. Routt ML Jr, Simonian PT, Grujic L. The retrograde medullary superior pubic ramus screw for the treatment of anterior pelvic ring disruptions: a new technique. J Orthop Trauma 1995;9:35-44.ArticlePubMed
- 7. Chen KN, Wang G, Cao LG, Zhang MC. Differences of percutaneous retrograde screw fixation of anterior column acetabular fractures between male and female: a study of 164 virtual three-dimensional models. Injury 2009;40:1067-72.ArticlePubMed
- 8. Attias N, Lindsey RW, Starr AJ, Borer D, Bridges K, Hipp JA. The use of a virtual three-dimensional model to evaluate the intraosseous space available for percutaneous screw fixation of acetabular fractures. J Bone Joint Surg Br 2005;87:1520-3.ArticlePubMedPDF
- 9. Shahulhameed A, Roberts CS, Pomeroy CL, Acland RD, Giannoudis PV. Mapping the columns of the acetabulum: implications for percutaneous fixation. Injury 2010;41:339-42.ArticlePubMed
- 10. Bi C, Ji X, Wang F, Wang D, Wang Q. Digital anatomical measurements and crucial bending areas of the fixation route along the inferior border of the arcuate line for pelvic and acetabular fractures. BMC Musculoskelet Disord 2016;17:125.ArticlePubMedPMC
- 11. Puchwein P, Enninghorst N, Sisak K, et al. Percutaneous fixation of acetabular fractures: computer-assisted determination of safe zones, angles and lengths for screw insertion. Arch Orthop Trauma Surg 2012;132:805-11.ArticlePubMedPDF
- 12. Suzuki T, Soma K, Shindo M, Minehara H, Itoman M. Anatomic study for pubic medullary screw insertion. J Orthop Surg (Hong Kong) 2008;16:321-5.ArticlePubMedPDF
- 13. Altınayak H, Balta O. Is percutaneous fixation of the superior pubic ramus possible in all types of pelvis. Ulus Travma Acil Cerrahi Derg 2023;29:419-29.ArticlePubMedPMC
- 14. Fernandes ML, Dos Santos DG, Costa-Santos C, Pereira PA, Pinho AR, Leite MJ. Iliopubic rami morphology and its vascular relationships in percutaneous retrograde fixation. Surg Radiol Anat 2025;47:200.ArticlePubMedPMCPDF
- 15. Jarragh A, Lari A, Shaikh M. A computed tomography (CT) based morphometric study of superior pubic ramus anatomy among Arabs to determine safe intramedullary pubic rami screw insertion. Surg Radiol Anat 2023;45:603-9.ArticlePubMedPDF
- 16. Hammond E, Nassereddin A, Costanza M. Anatomy, abdomen and pelvis: external iliac arteries [Internet]. StatPearls Publishing; 2025 [cited 2026 Jan 10]. Available from: https://www.ncbi.nlm.nih.gov/books/NBK519552/.
References
Figure & Data
REFERENCES
Citations
Citations to this article as recorded by 
 ePub Link
 Cite
CiteSex-specific bottlenecks and risk zones in the retrograde superior pubic ramus screw corridor: a 3D CT-based morphometric cadaver study
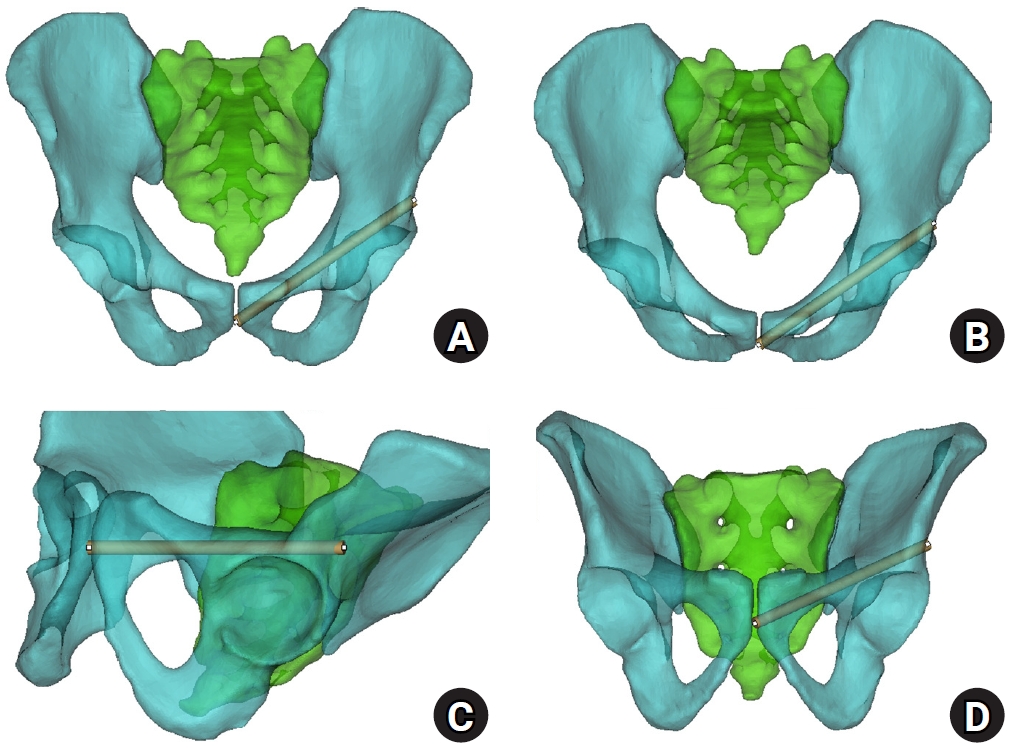
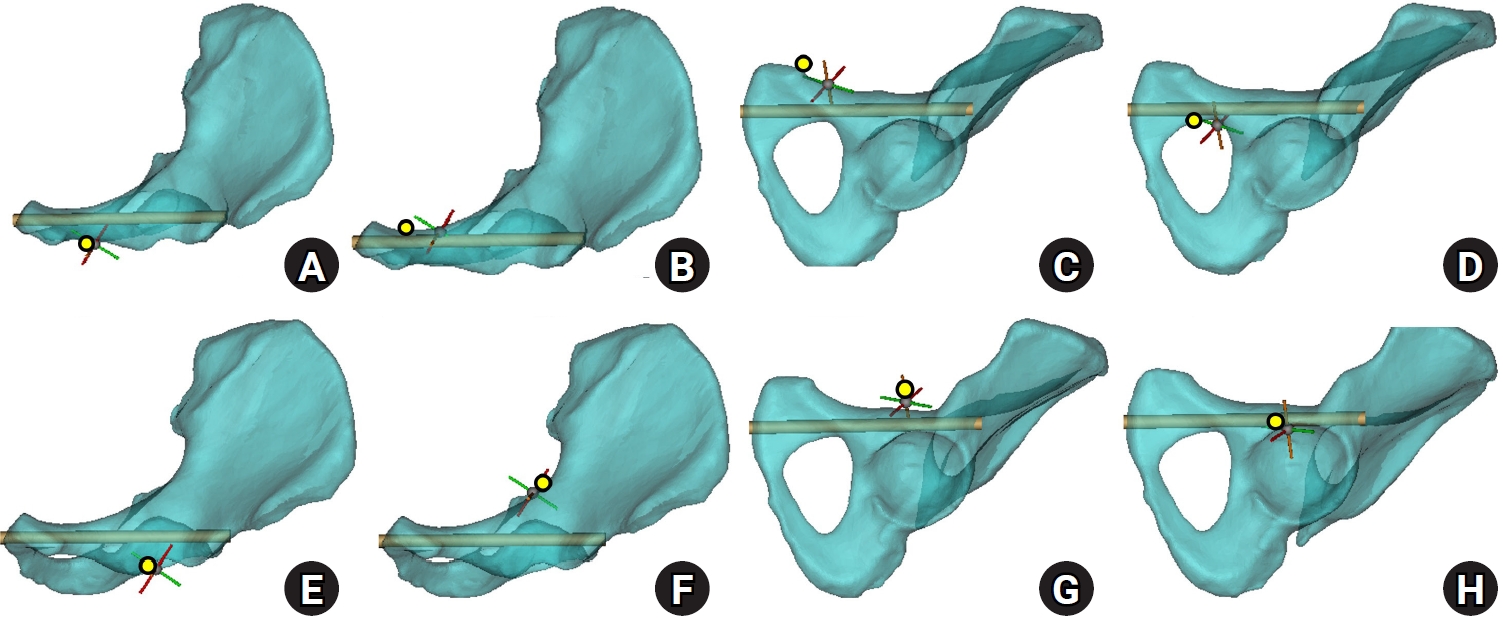

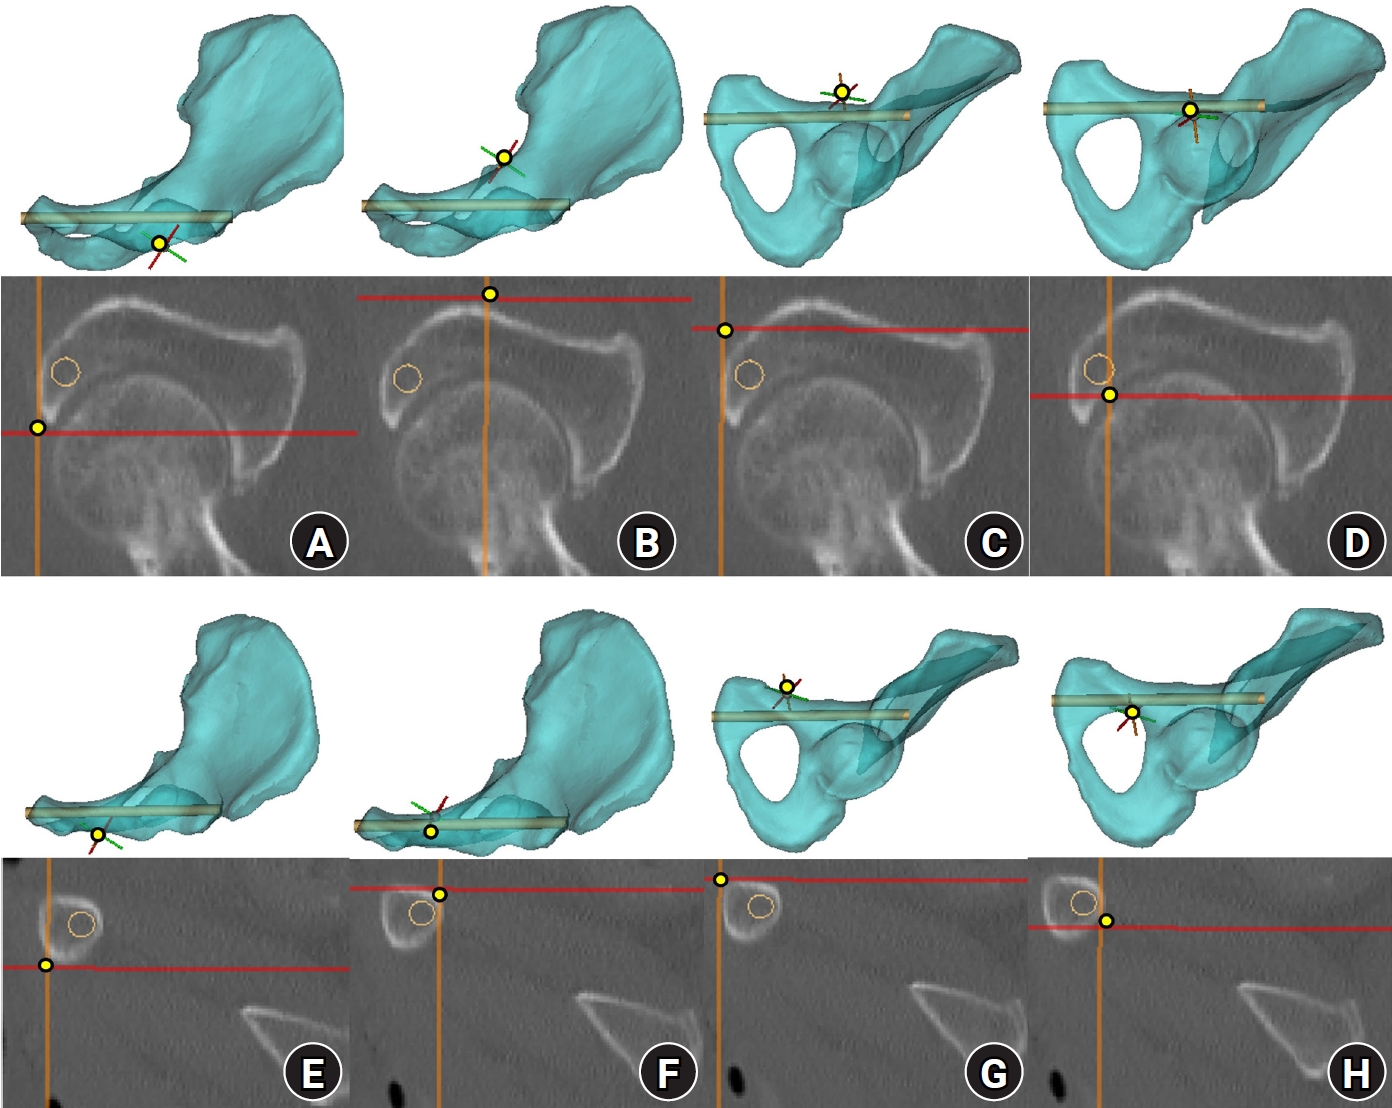
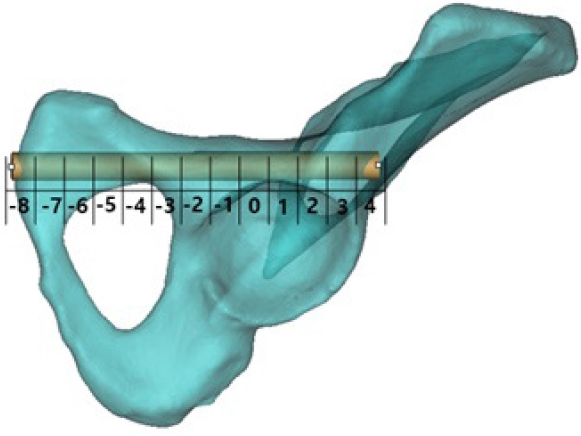


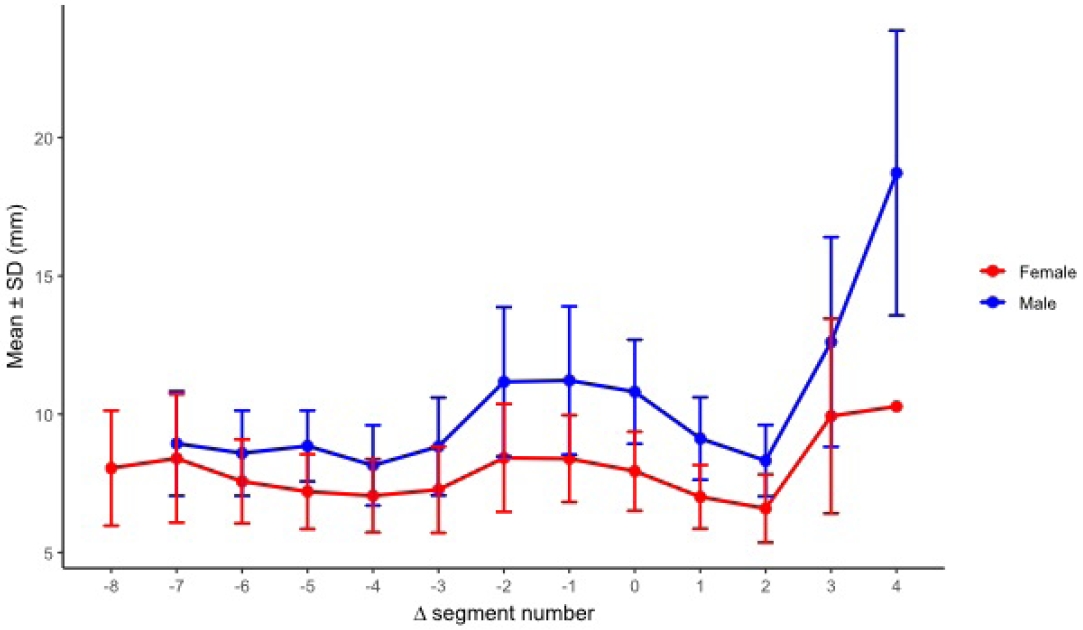

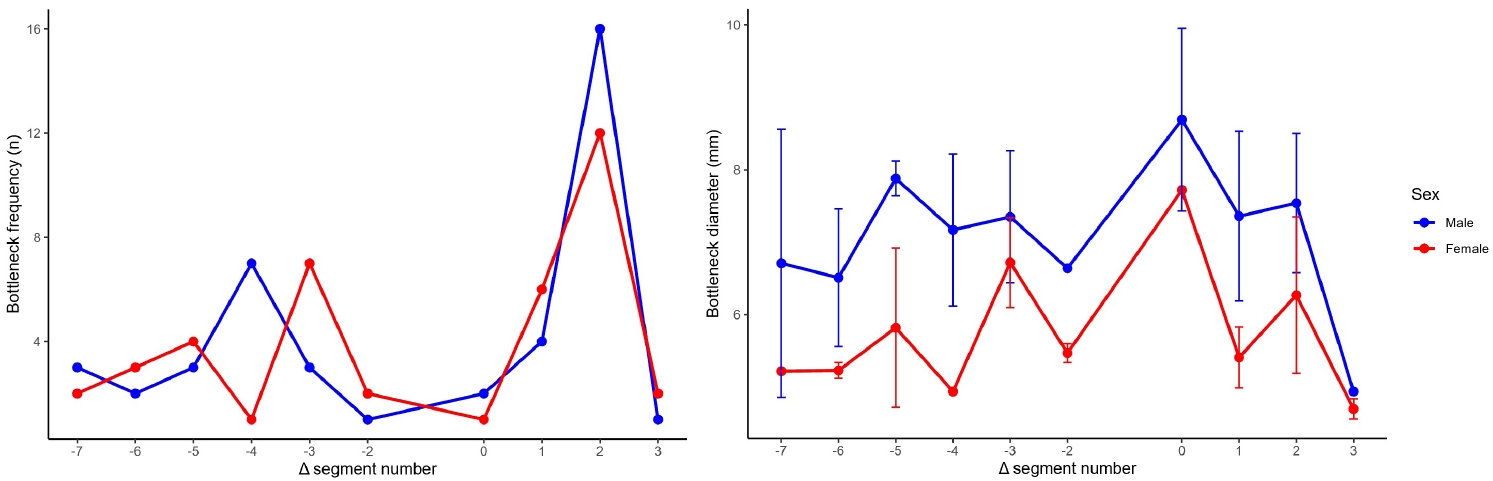

Fig. 1. Virtual cylinder positioning and biomechanical orientation. (A) Pelvis anteroposterior view. (B) Pelvis inlet view. (C) Obturator oblique outlet view. (D) Outlet view.
Fig. 2. Corridor boundaries in the preacetabular and periacetabular regions. In the three-dimensional hemipelvis model, yellow dots delineate the boundaries of the preacetabular zone: the lateral (A) and medial (B) margins on the inlet view, the superior margin on the obturator oblique outlet (OOO) view (C), and the inferior margin (D). Corresponding boundaries of the periacetabular zone include the lateral (E) and medial (F) margins on the inlet view, the superior margin on the OOO view (G), and the inferior margin (H).
Fig. 3. Axial cylinder and obturator oblique outlet views for measurement of bottleneck diameter and intraosseous corridor length. (A) On the axial cylinder view, the superior ramus screw corridor was assessed, and the bottleneck diameter was measured as the largest cylinder diameter that could be accommodated without cortical violation. (B) On the obturator oblique outlet view, the total cylinder length was measured to define the intraosseous corridor length.
Fig. 4. Corridor boundaries in the preacetabular and periacetabular zones on resliced computed tomography (CT) images. The three-dimensional hemipelvis model and corresponding resliced CT images illustrate the spatial correspondence of each corridor boundary. (A–D) CT images demonstrate the medial, lateral, superior, and inferior margins of the preacetabular zone. (E–H) CT images demonstrate the medial, lateral, superior, and inferior margins of the periacetabular zone. Yellow dots indicate corridor boundaries, and orange circles indicate the virtual cylinder.
Fig. 5. Acetabular-referenced Δ seg analysis. Using acetabulum-referenced alignment, effective corridor diameter (D eff, seg) and cortical clearance (clearance seg) were calculated at each Δ seg position using all available measurements. Bottleneck frequency was defined as the number and percentage of pelvises in which the bottleneck occurred at each Δ seg position.
Fig. 6. Segment numbering and distance measurements for segment-wise corridor assessment. (A) In the three-dimensional hemipelvis model, the obturator oblique outlet view illustrates division of the corridor into up to 12 segments from the entry point to the distal lateral iliac cortex, with segments numbered sequentially; segment 8 was designated as the acetabular start segment. In the preacetabular region (proximal to the acetabular start segment), (B) effective distance was defined as the minimum perpendicular distance from the cylinder centerline to each cortical boundary, and (C) cortical clearance was defined as the minimum perpendicular distance from the cylinder surface to each cortical boundary. In the periacetabular region (distal to the acetabular start segment), (D) effective distance and (E) cortical clearance were defined analogously. All segment definitions and boundary measurements were performed according to a prespecified protocol uniformly applied across models.
Fig. 7. Segment-wise effective diameter by sex across 12 segments. Between-sex comparisons were performed using independent-samples t-tests, and P-values were adjusted using the Benjamini-Hochberg false discovery rate for 12 segment-wise comparisons. Sex differences were significant for segments 2–11 (all P_FDR<0.001) but not for segments 1 or 12 (P_FDR=0.423 and 0.123, respectively). SD, standard deviation.
Fig. 8. Segment-wise cortical clearance (safety margin) by sex across 12 absolute segments. Sex-based differences were significant in segments 1, 6, 7, 8, and 11 (P_FDR=0.0249, 0.00095, 0.00458, 0.00095, and 0.00133, respectively) and were not significant in the remaining segments (all P_FDR ≥0.203). SD, standard deviation; FDR, false discovery rate.
Fig. 9. Segment-wise effective diameter by sex after realignment to the acetabular start segment (Δ seg). No sex-based difference was detected at Δ seg −7 (P_FDR=0.282), whereas males exhibited larger effective diameters than females from Δ seg −6 through Δ seg 3 (all P_FDR≤0.00369). SD, standard deviation; FDR, false discovery rate.
Fig. 10. Segment-wise cortical clearance (safety margin) by sex after realignment to the acetabular start segment (Δ seg). Males demonstrated greater cortical clearance at Δ seg −2, −1, 0, and 1 (P_FDR=0.0107, 0.0107, 0.000664, and 0.0131, respectively), whereas no significant sex-based differences were observed at other Δ seg levels with adequate sample size. SD, standard deviation; FDR, false discovery rate.
Fig. 11. Bottleneck location frequency and diameter by sex after realignment to the acetabular start segment (Δ seg). The distribution of bottleneck locations across relative segments (Δ seg −7 to 3) did not differ by sex (Fisher exact test with Monte Carlo simulation, P=0.461). Within Δ seg positions, the most pronounced sex-based difference in bottleneck diameter was observed at Δ seg 2 (Welch t-test P=0.0038; Benjamini-Hochberg FDR-adjusted P=0.023), whereas nominal differences at Δ seg −5 and 1 did not remain significant after FDR correction. SD, standard deviation; FDR, false discovery rate.
Fig. 12. Diameter-dependent feasibility by sex. Proportion of pelvis models accommodating the cylinder diameter along the retrograde superior pubic ramus trajectory. Feasibility was 100% at 3.5–4.5 mm in both sexes, declined at 5.0 mm (male 95.2% vs. female 82.5%; P_FDR=0.084), and showed significant sex differences at 6.5 mm (81.0% vs. 27.5%) and 7.3 mm (59.5% vs. 10.0%). FDR, false discovery rate.
Fig. 1.
Fig. 2.
Fig. 3.
Fig. 4.
Fig. 5.
Fig. 6.
Fig. 7.
Fig. 8.
Fig. 9.
Fig. 10.
Fig. 11.
Fig. 12.
Sex-specific bottlenecks and risk zones in the retrograde superior pubic ramus screw corridor: a 3D CT-based morphometric cadaver study

