Radiologic and Serologic Factors Associated with Bone Union at Femoral Atypical Fracture
Article information
Abstract
Abstract
Purpose
The purpose of this study was to investigate the radiologic and serologic factors related to postoperative union using intramedullary (IM) internal fixation in atypical femoral fractures (AFF), which are closely related to bisphosphonates (BPs) for osteoporosis.
Materials and Methods
From February 2008 to December 2016, 65 patients (71 cases) who had undergone IM nail fixation after diagnosis of AFF were enrolled in this study. Patients were divided into group A, who experienced union within 6 months and group B, who did not experience union within 6 months. They were evaluated for duration of BPs use, radiologic factors and serological factors.
Results
The mean duration of BPs use was 6.17 years in group A and 8.24 years in group B (p=0.039). In the subtrochanteric area, there were 14 cases (27.5%) in group A and 14 cases (70.0%) in group B. In the femoral shaft, there were 37 cases (72.5%) in group A and 6 cases (30.0%) in group B (p=0.001). On the preoperative, the flexion in the coronal plane was 5.9o (2.1o-9.2o) in group A and 8.0o (3.1o-12.1o) in group B (p=0.041). On the postoperative, conversion to valgus was 15 cases (29.4%), 8 cases (40.0%); conversion to neutral was 34 cases (66.7%) and 8 cases (40.0%); conversion to varus was 2 cases (3.9%) and 4 cases (20.0%), each (p=0.037). The fracture site gap was 1.5 mm (0–2.9 mm) on the front side and 1.2 mm (0–2.2 mm) on lateral side and 2.2 mm (0.9–4.7 mm) and 1.9 mm (0.5–3.5 mm), each (p=0.042, p=0.049). Among serological factors, there was no significant difference between the two groups.
Conclusion
Factors adversely affecting the union should be recognized before surgery, such as longterm BPs use or a severe degree of bending of the femur in the coronal plane. During surgery, proper reduction and spacing of the fracture site on the coronal plane should allow adequate reduction of the anterior and posterior surfaces. Obtaining anatomic reduction would be most beneficial for union, but if that is not possible, obtaining congenital valgus rather than varus on the coronal plane may be helpful for union.
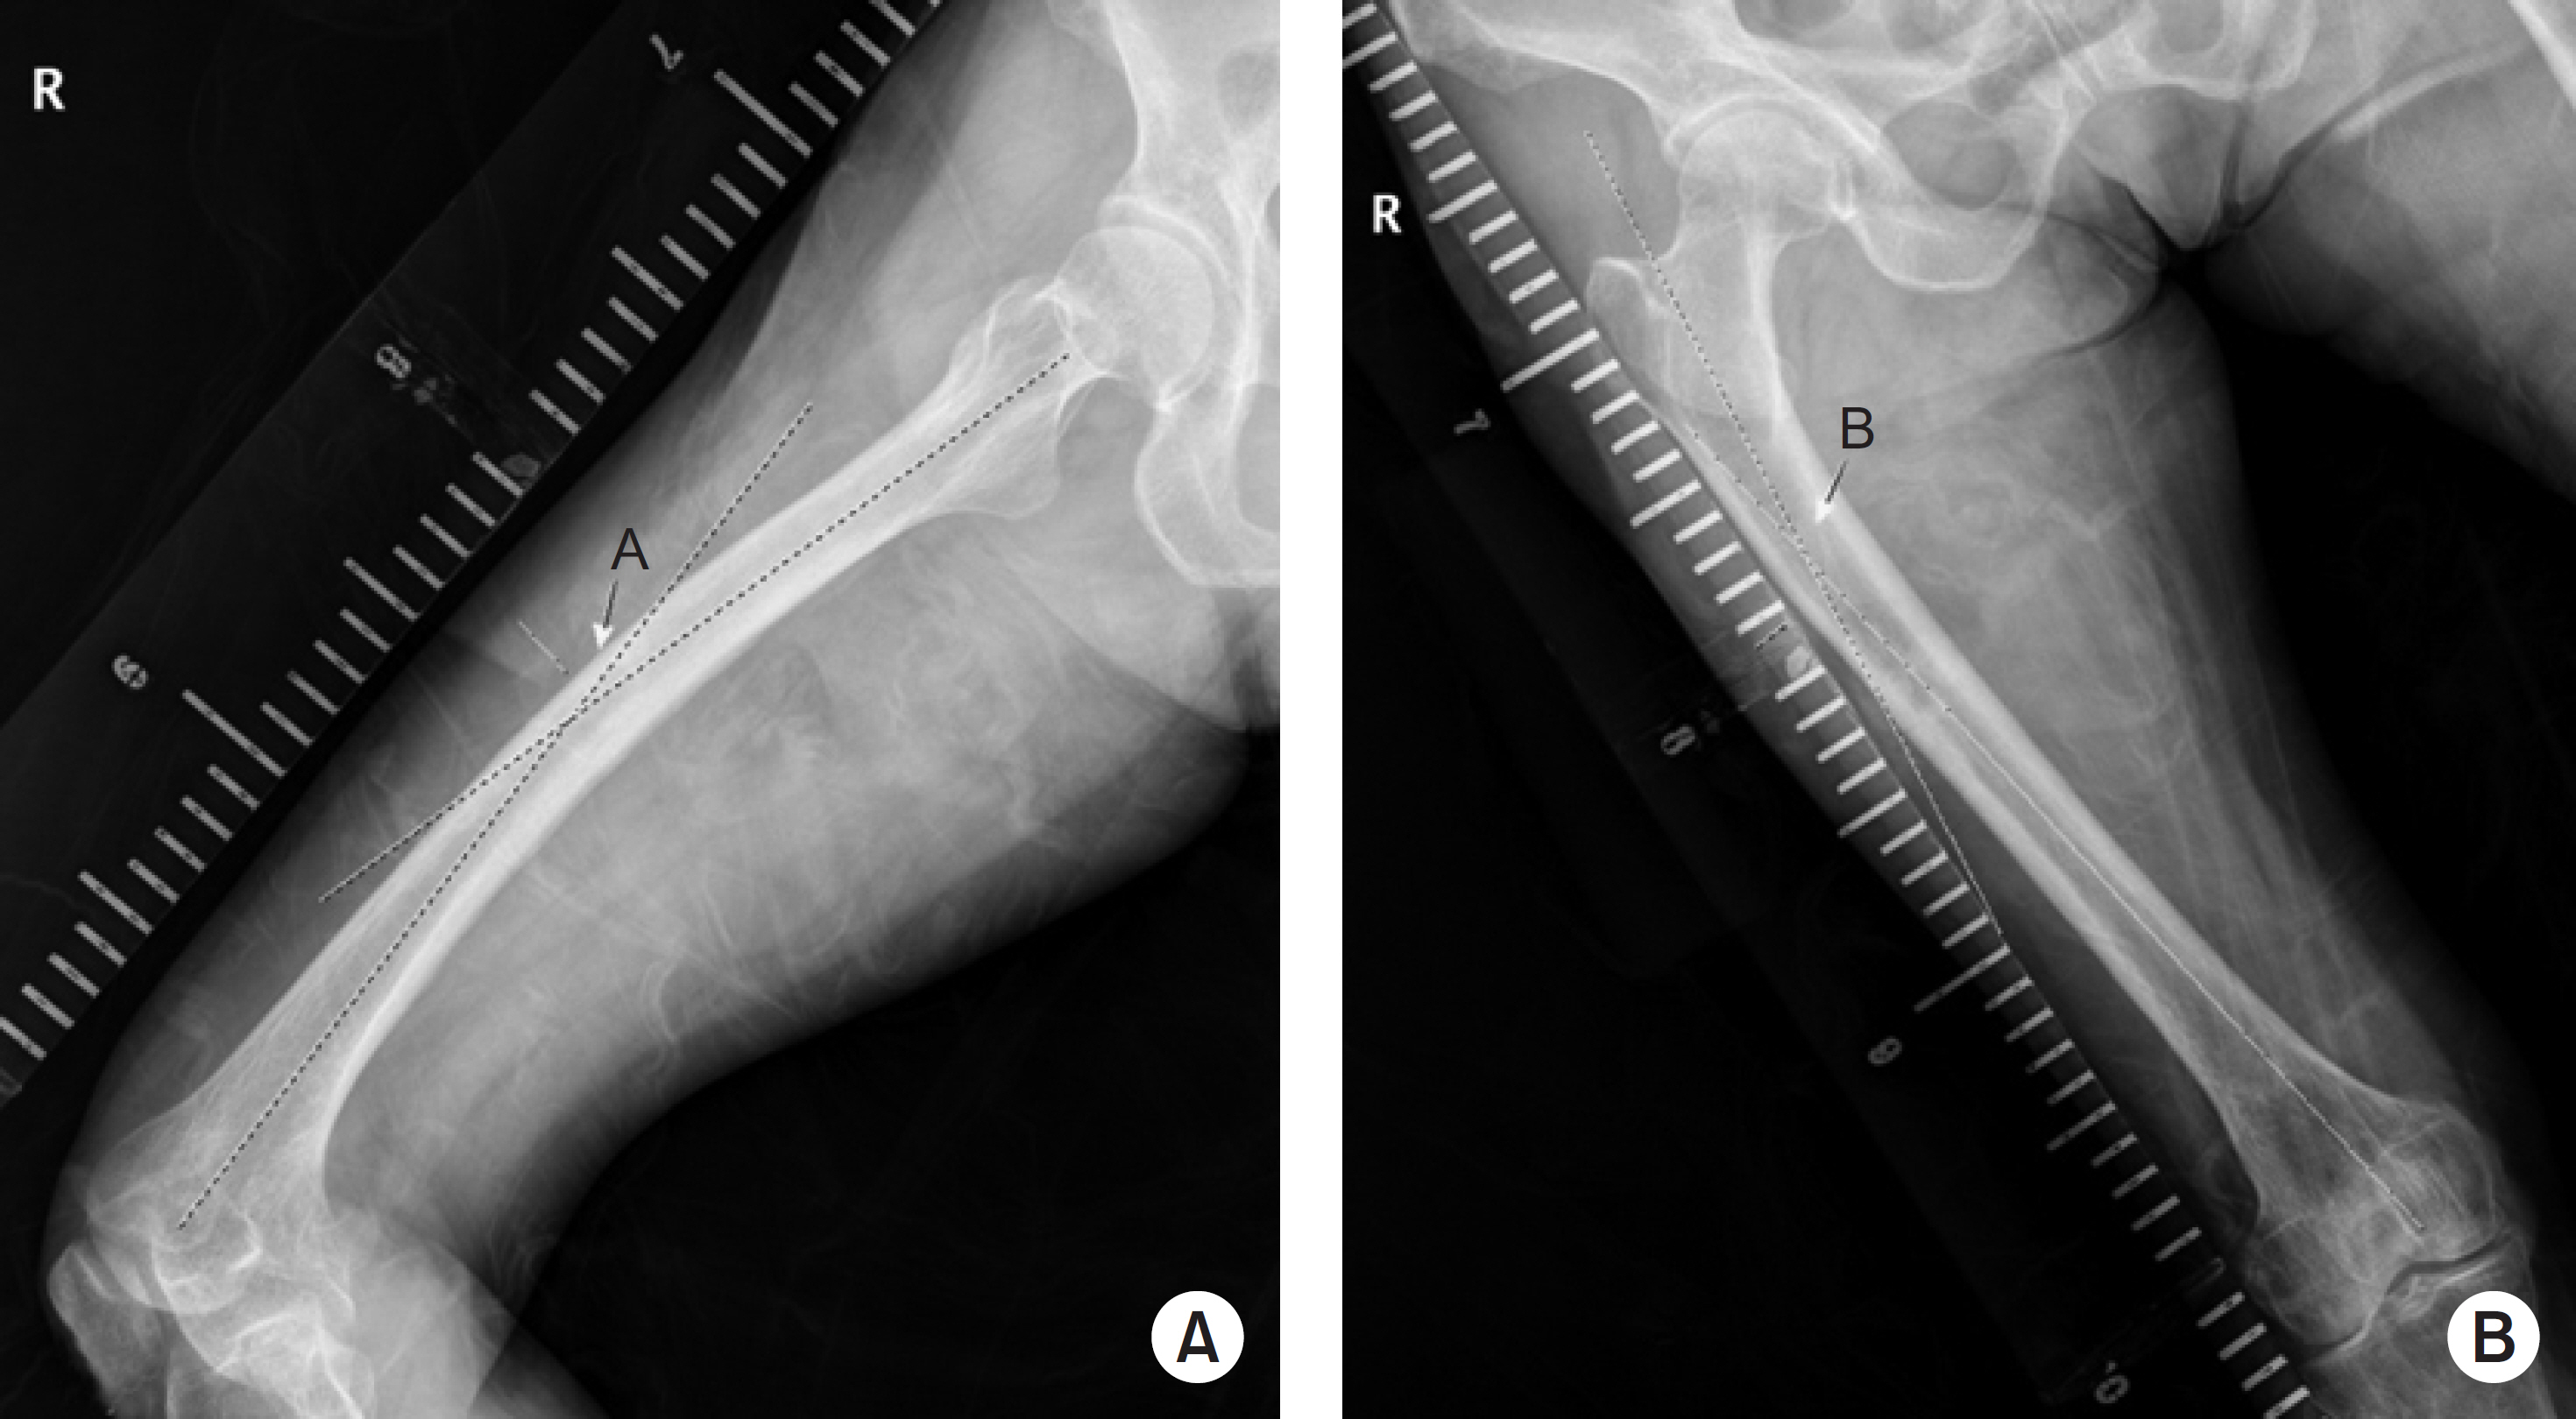
(A) Coronal view of the angle formed by two straight lines that pass the center of the proximal and distal parts, parallel to each other (letter ‘A’). (B) Lateral view of the same two lines (letter ‘B’).
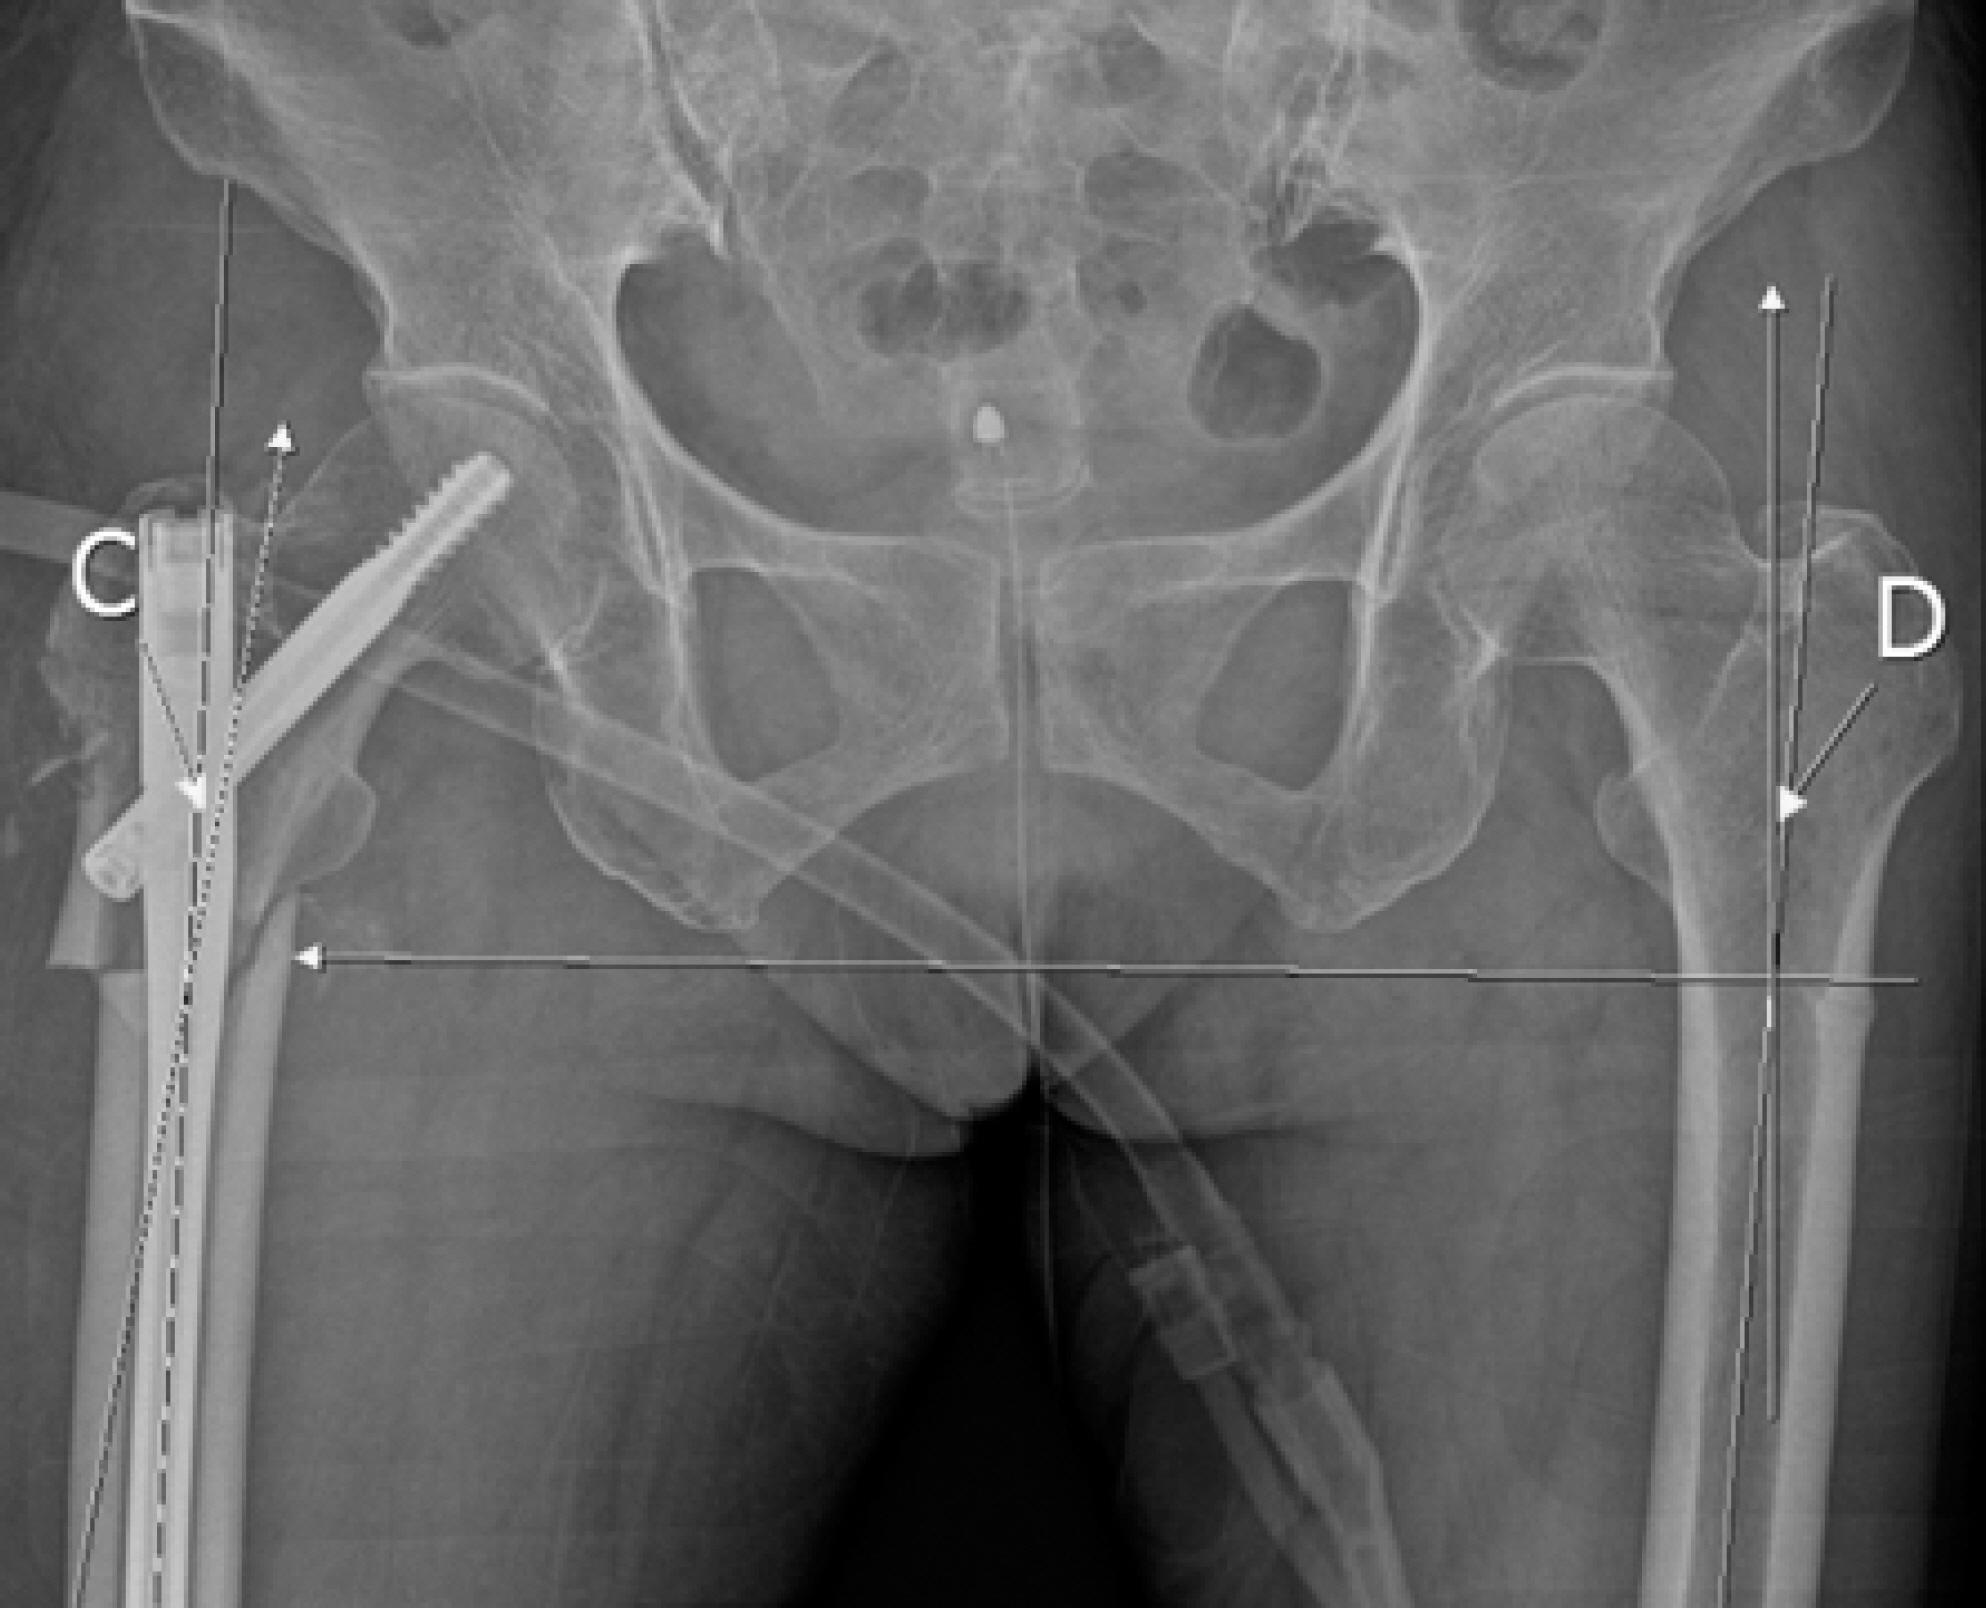
In the coronal plane, the angle that the proximal and distal fragments make on the same line as the fracture line based on the unaffected side (letter ‘C’), The angle that the distal and proximal fragments make on the basis of the fracture site of the affected side (letter ‘D’). If C-D is 0: neutral, (–): valgus, (+): varus.
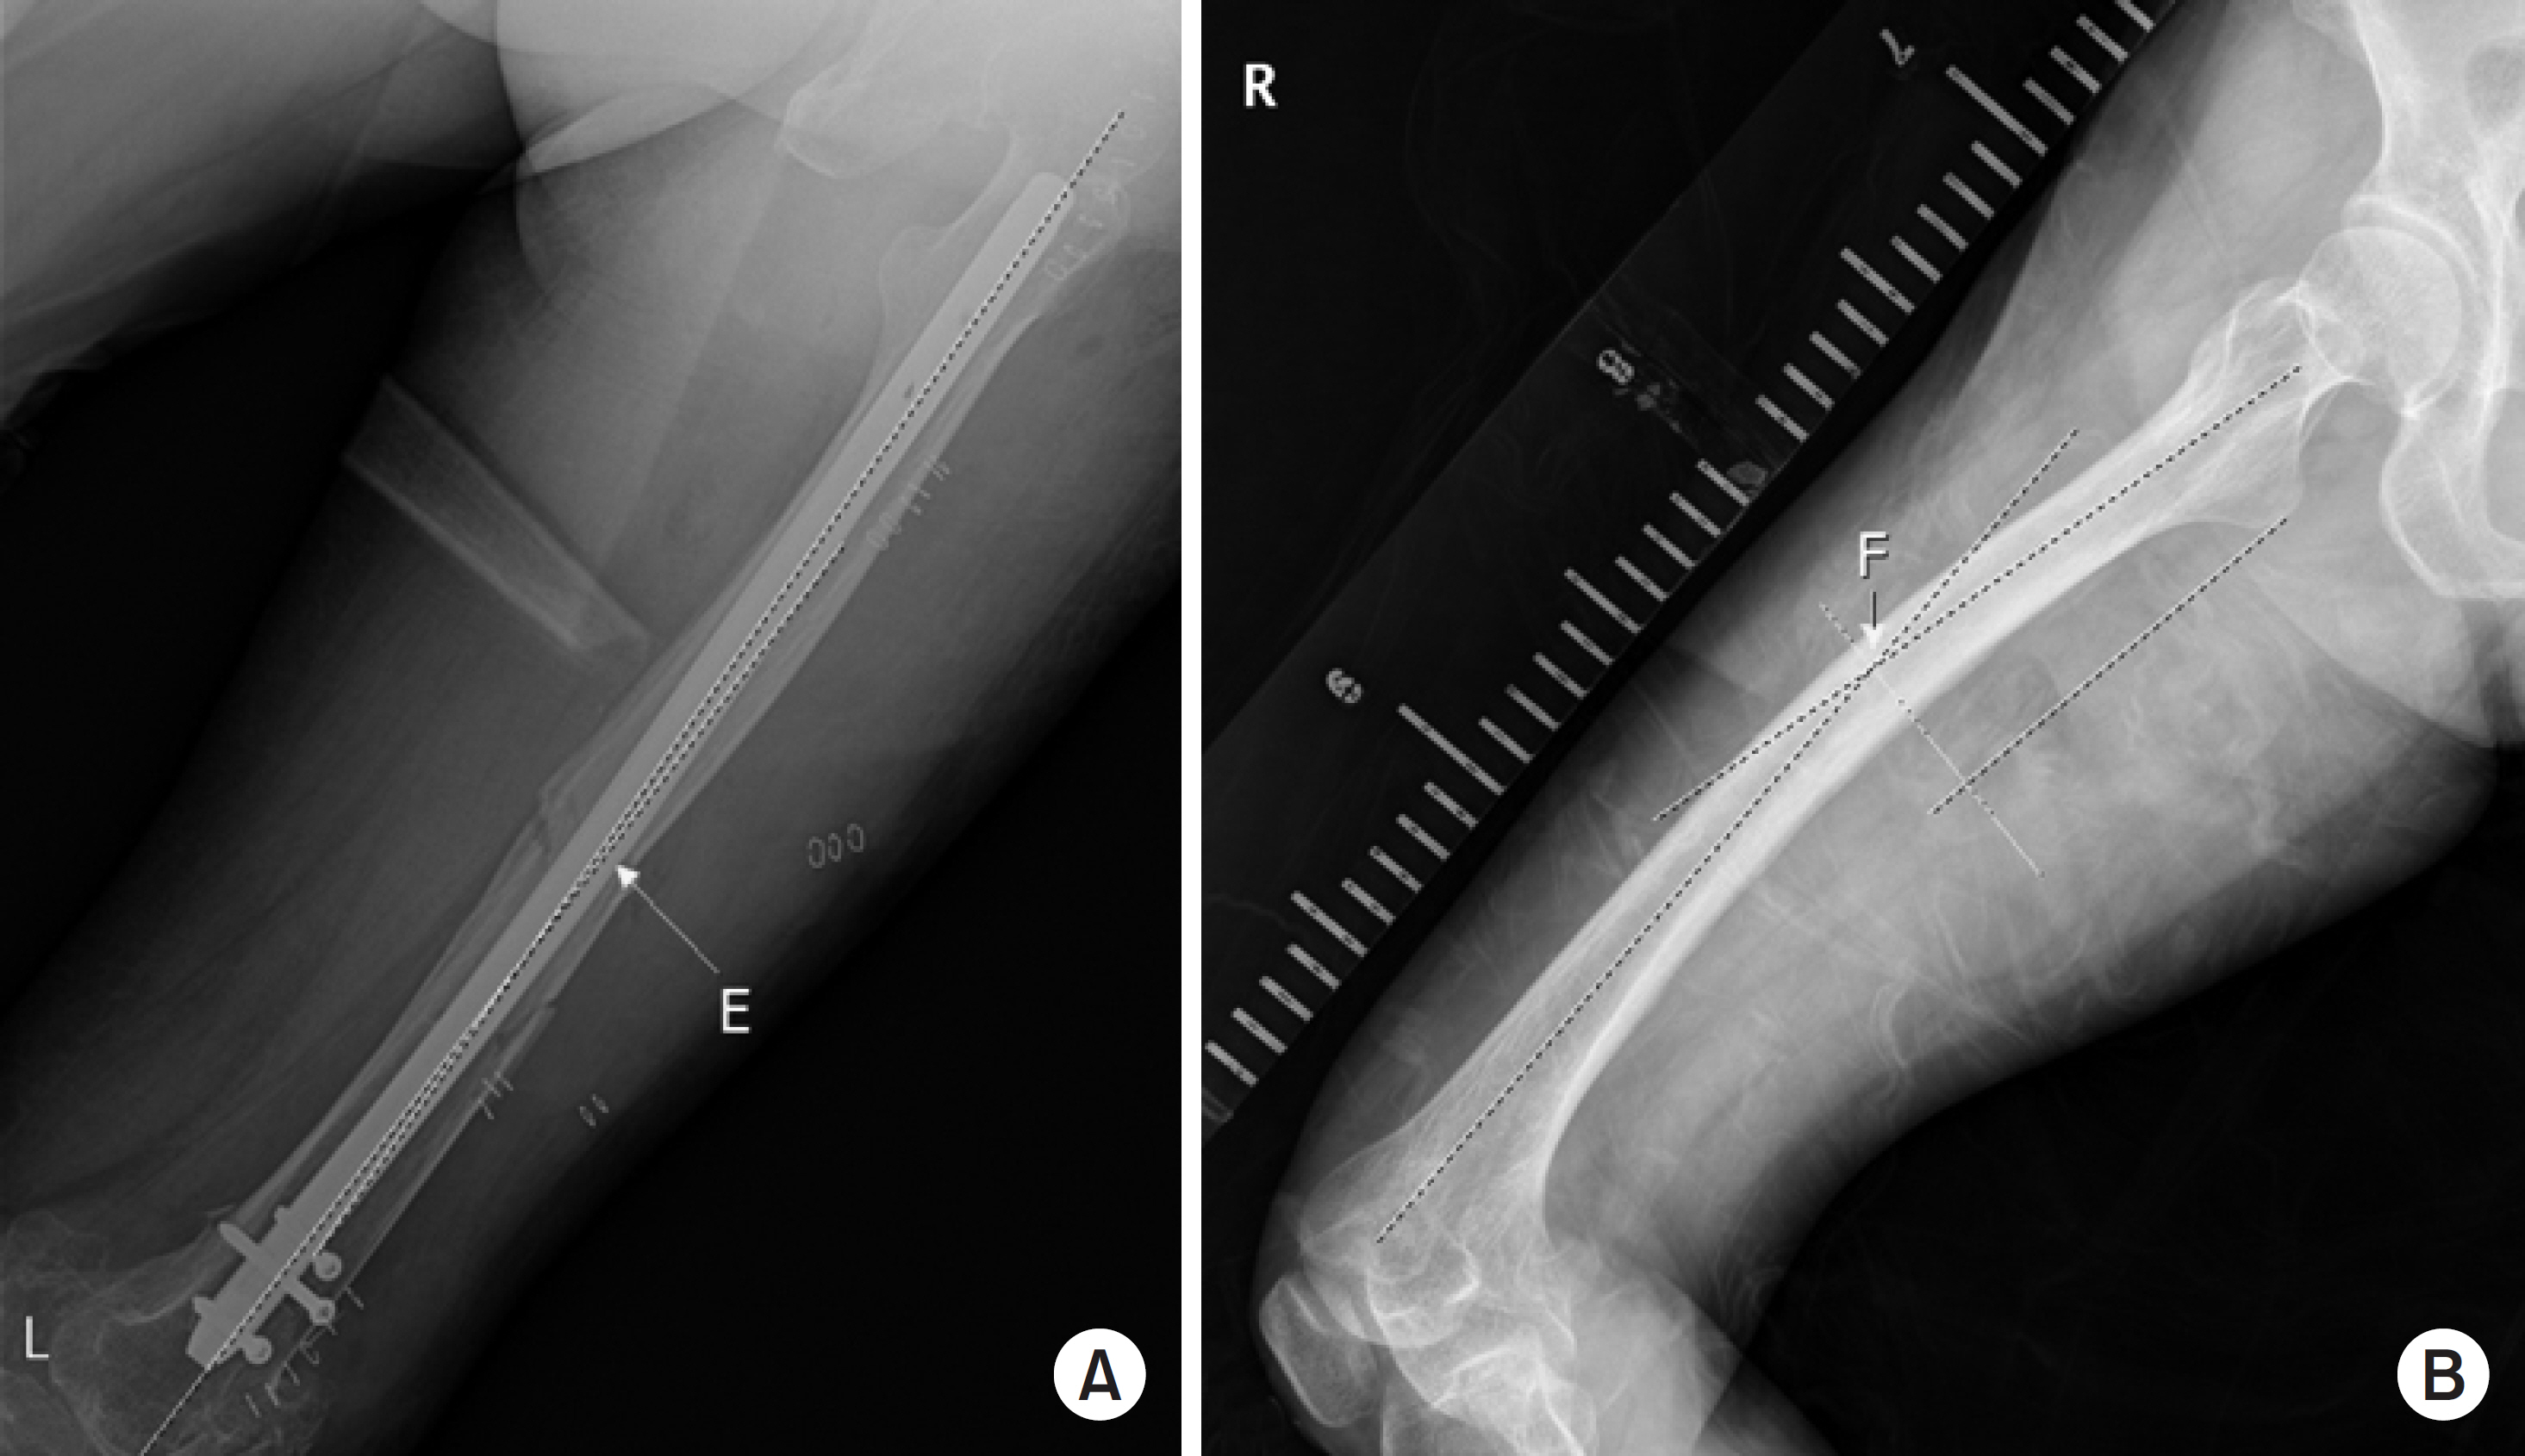
(A) The angle that the proximal and distal fragments make based on the fracture site in the coronal plane (letter ‘E’). (B) The value of the unaffected site on the basis of the affected site (letter ‘F’). If E-F is 0: neutral, (+): flexion, (–): extension.
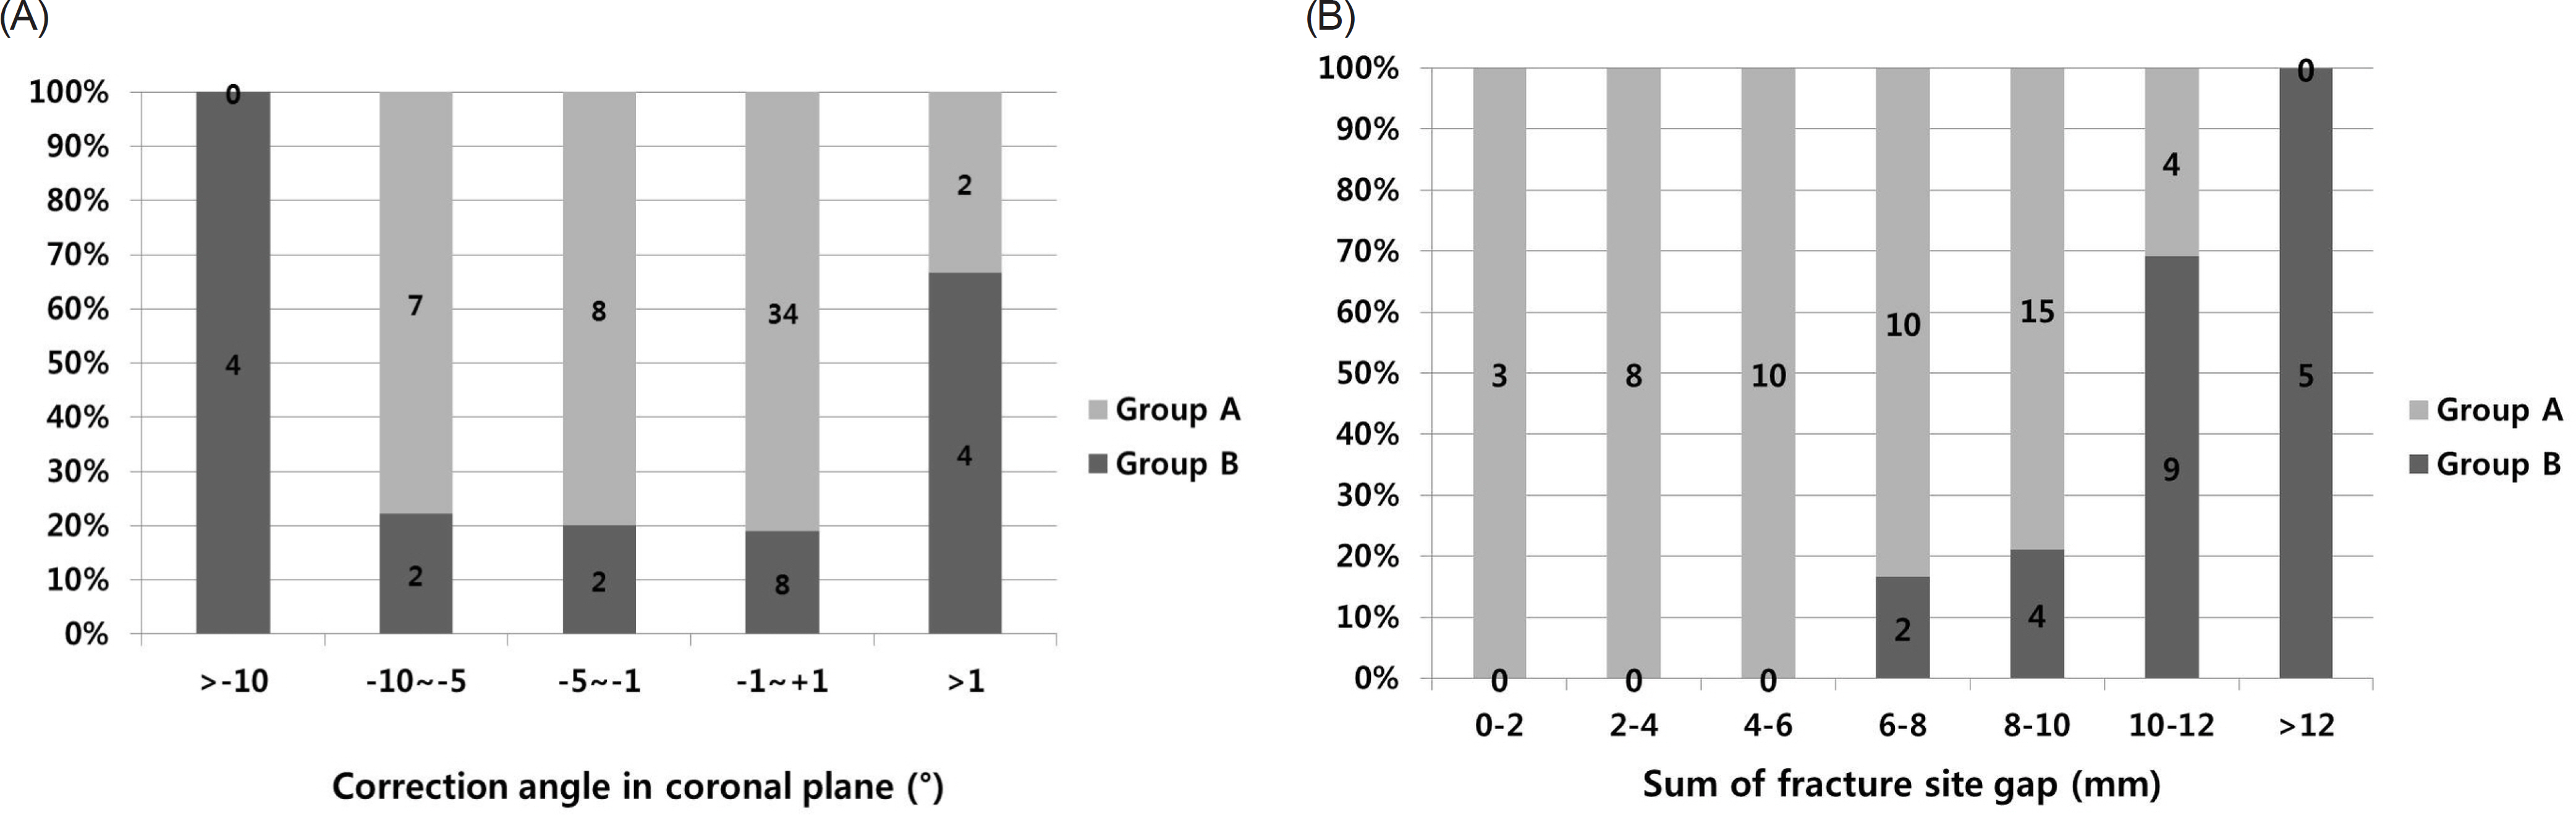
(A) Incidence of delayed union according to the correction angle in the coronal plane. (B) Incidence of delayed union according to the sum of the remaining anterior, posterior, medial and lateral gap sizes obtained from anteroposterior and lateral radiographs. Group A experienced union within 6 months of surgery. Group B did not experience union within 6 months.

Baseline Patients Characteristics

Fracture Site and Bisphosphonate Administration History

Radiographic Characteristics

Serologic Characteristics